Why Investors Pull Back During Wars (and Where They Still Invest)
March 18, 2026 by Harshit Gupta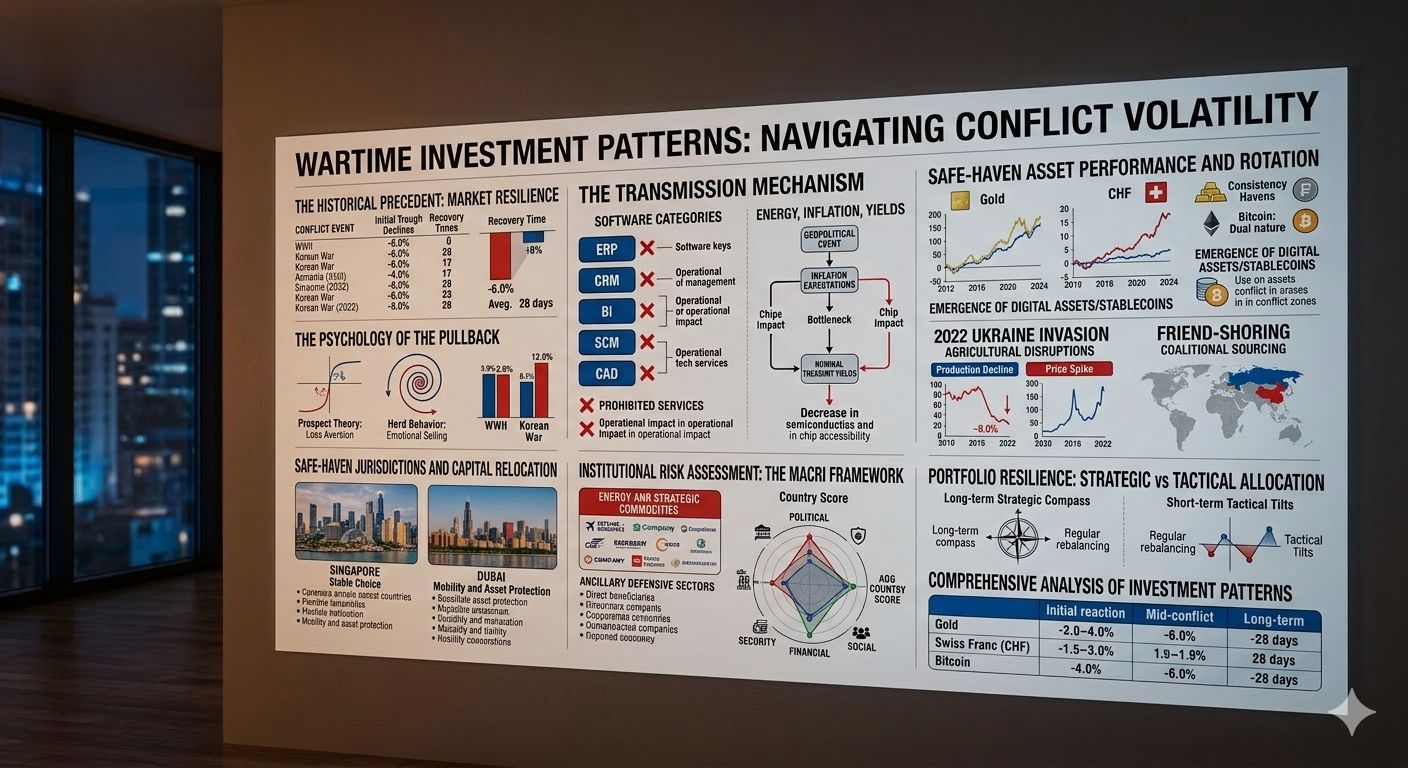
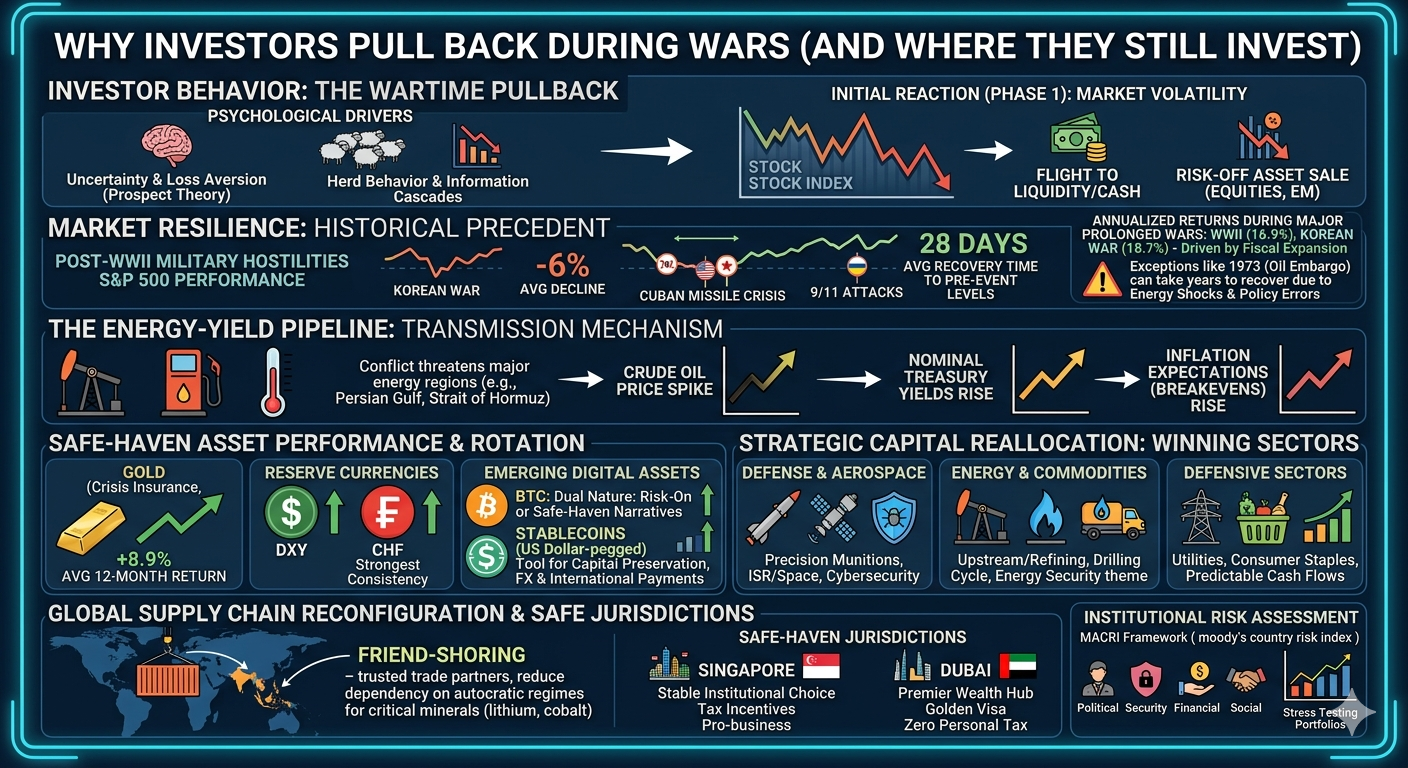
The intersection of military conflict and global financial markets creates a volatile environment where psychological impulses often collide with structural economic shifts. While the immediate reaction to the outbreak of war is frequently characterized by a sharp withdrawal of capital from risk-sensitive assets, historical evidence suggests that financial markets possess a remarkable capacity for resilience once the parameters of a conflict are established. Understanding the motivations behind this initial pullback—and identifying the specific vehicles that attract capital during periods of heightened tension—is essential for institutional investors and wealth managers navigating an increasingly fragmented geopolitical landscape.
The Historical Precedent: Market Resilience vs. Immediate Volatility
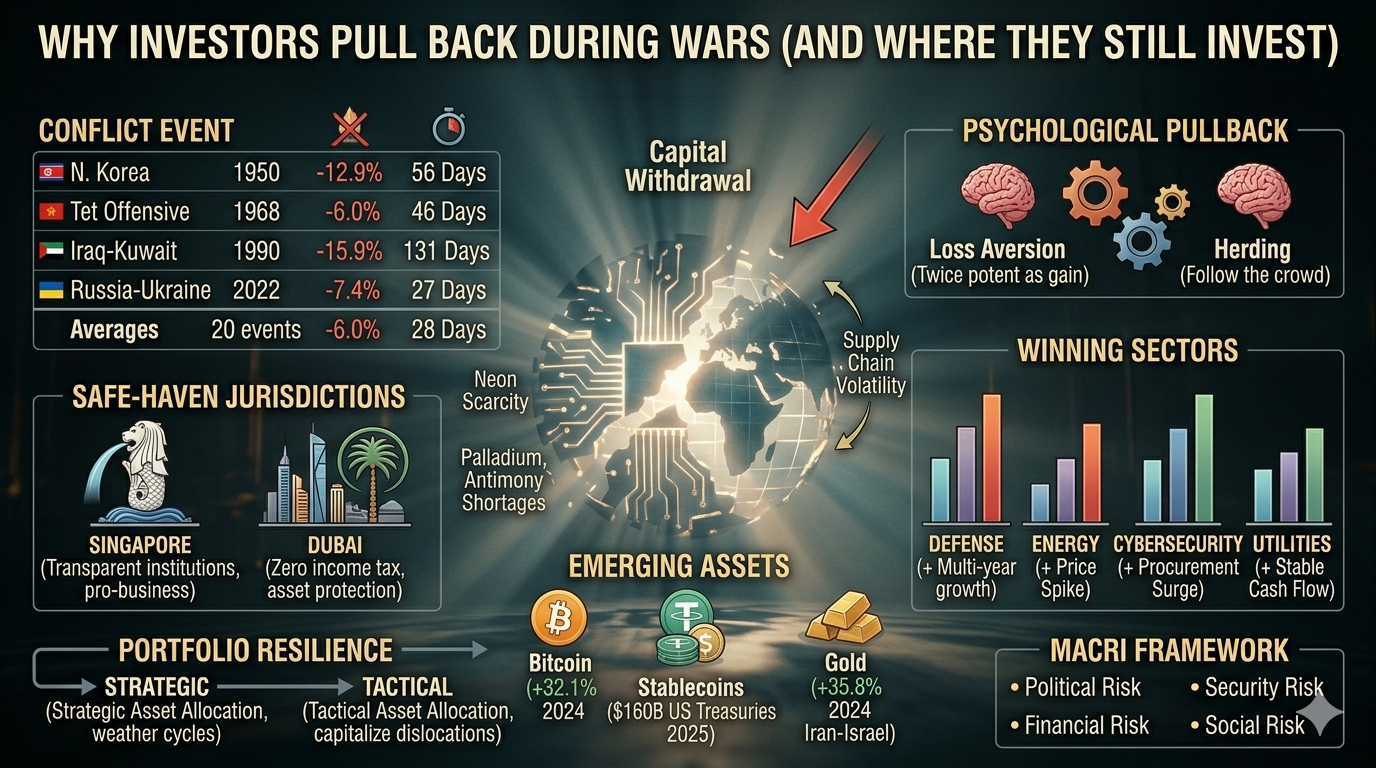
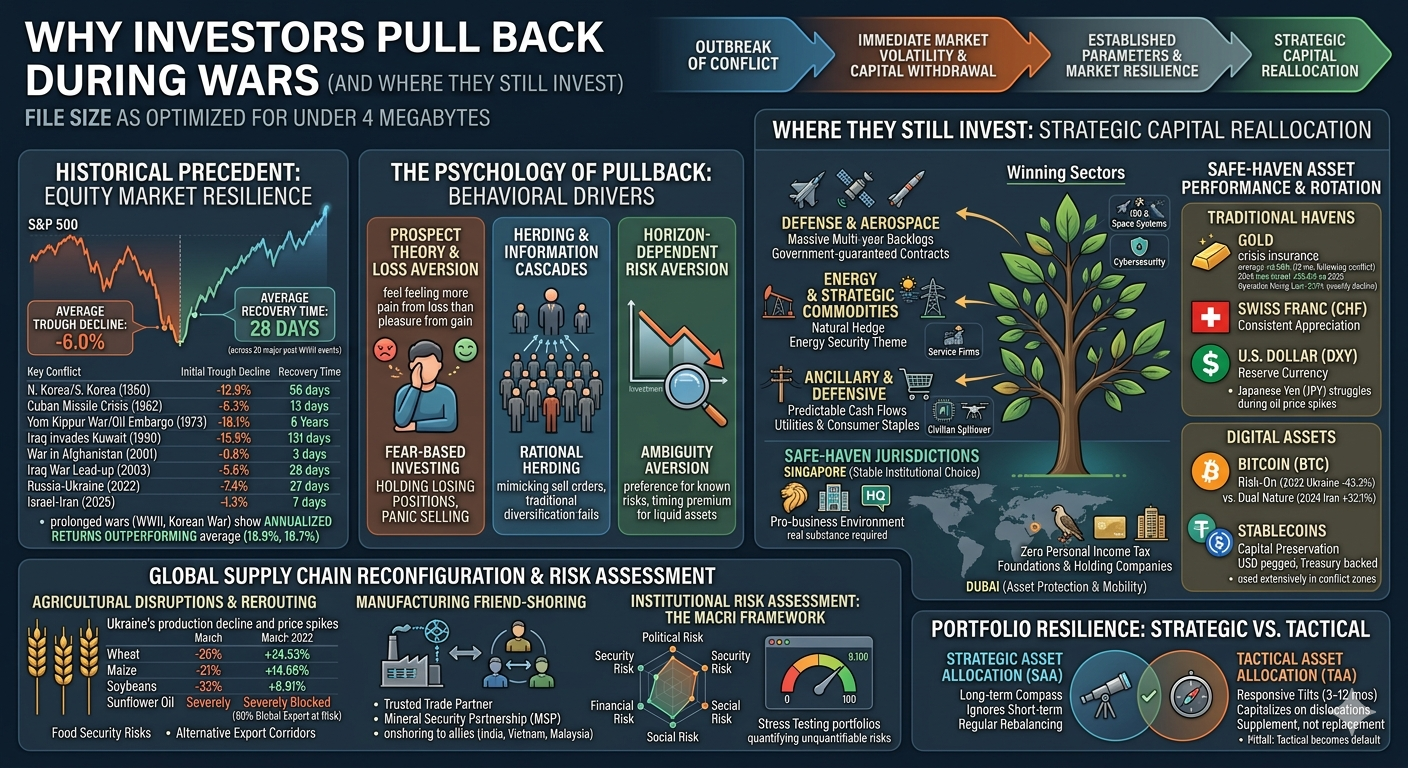
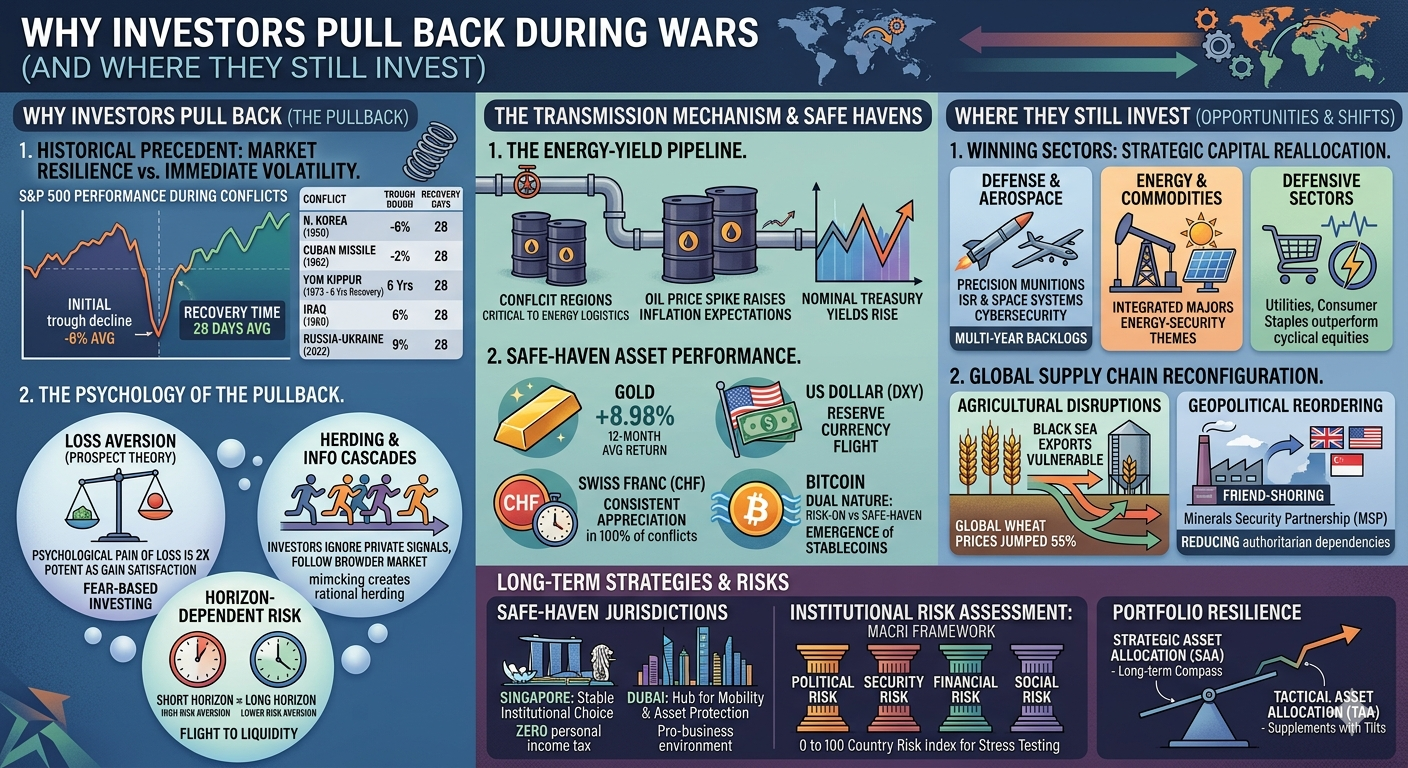
The historical record of equity market performance during military interventions provides a necessary corrective to the pervasive narrative of wartime economic collapse. In a comprehensive evaluation of twenty major post-World War II military hostilities, the S&P 500 fell by an average of only six percent from the initial market impact to its trough level. Most significantly, in nineteen out of those twenty events, the market required an average of just twenty-eight days to recover to its pre-conflict valuation, regardless of whether the actual military engagement persisted for months or decades. This suggests that the duration of a conflict has historically held less bearing on market performance than the initial shock of its onset.
However, certain conflicts have triggered much more severe corrections, typically when they intersect with global energy supplies. The 1973 Yom Kippur War and the subsequent Arab oil embargo, alongside the 1990 Iraqi invasion of Kuwait, resulted in double-digit stock market losses of 16.1 percent and 15.9 percent, respectively. In the case of the 1973 embargo, the market required six years to return to its previous peak, finally breaking even in 1979. This extended recovery was not solely a function of the war itself but was exacerbated by fiscal and monetary policy errors during a period of structural inflation. In contrast, the market reaction to the 2022 invasion of Ukraine was relatively contained, with a decline of 7.4 percent, largely because it became evident that Russian crude oil supplies would not be as catastrophically hindered as initially feared.
Conflict Event | Initial Trough Decline | Recovery Time to Pre-Event Levels |
N. Korea invades S. Korea (1950) | -12.9% | 56 Days |
Cuban Missile Crisis (1962) | -6.3% | 13 Days |
Tet Offensive, Vietnam (1968) | -6.0% | 46 Days |
Yom Kippur War/Oil Embargo (1973) | -16.1% | 6 Years |
Iraq invades Kuwait (1990) | -15.9% | 131 Days |
War in Afghanistan (2001) | -0.8% | 3 Days |
Iraq War Lead-up (2003) | -5.6% | 28 Days |
Russia-Ukraine Invasion (2022) | -7.4% | 27 Days |
Israel-Iran Conflict (2025) | -1.3% | 7 Days |
Averages (20 Historical Events) | -6.0% | 28 Days |
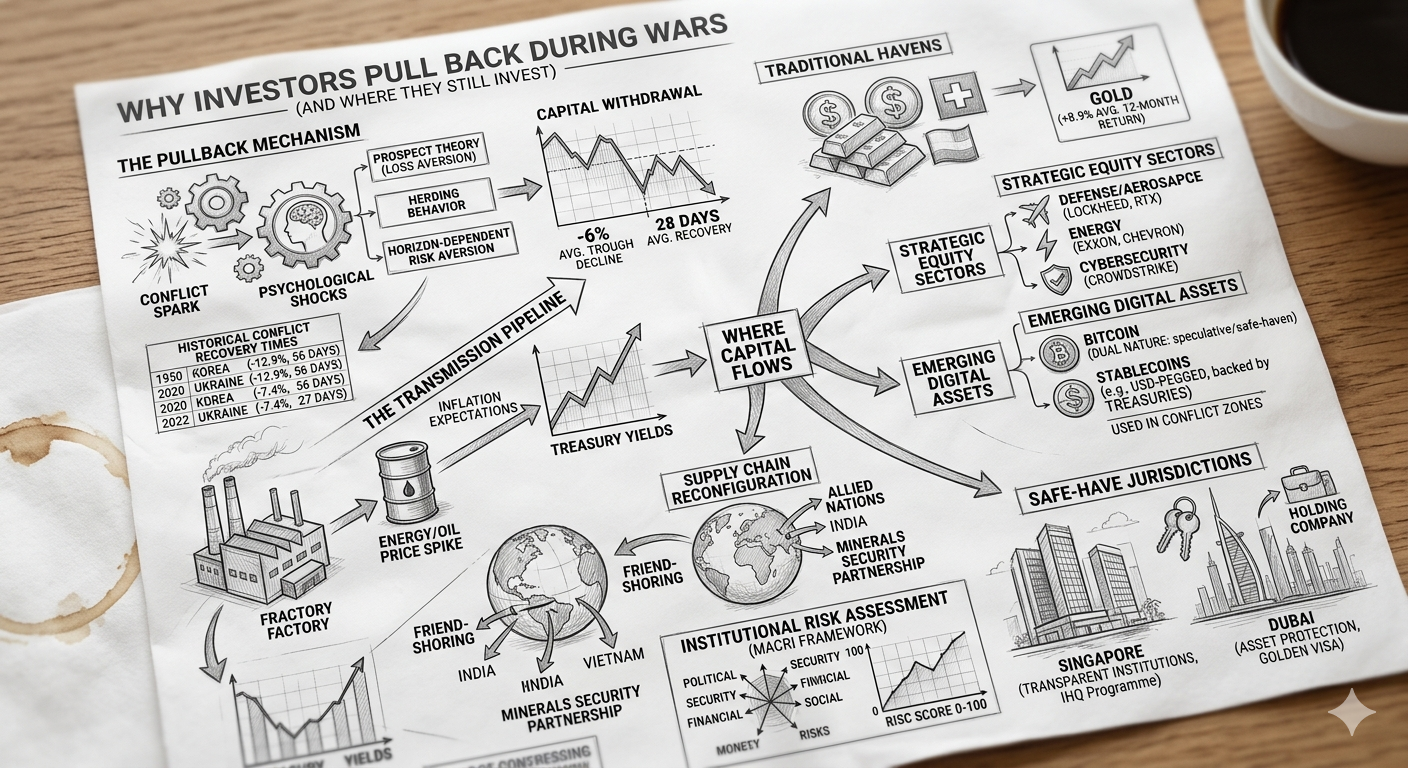
The resilience of the U.S. stock market during major prolonged wars is further evidenced by the annualized returns recorded during World War II (16.9 percent) and the Korean War (18.7 percent), both of which significantly outperformed the long-term historical average of eight to ten percent. This outperformance is often driven by massive fiscal expansion and industrial mobilization, which provide a powerful stimulus to domestic production and earnings.
The Psychology of the Pullback: Behavioral Drivers of Risk Aversion
The initial withdrawal of capital during a crisis is rarely a calculated response to long-term fundamentals. Instead, it is driven by a series of psychological biases that dominate decision-making under conditions of "unprecedented uncertainty". The distinction between risk—which can be modeled using historical data—and uncertainty—where the fundamental anchors for valuation are lost—is critical to understanding market instability. Geopolitical conflicts are archetypal "uncertainty" events that trigger instinctual, heuristic-driven behaviors over rational calculation.
Prospect Theory and Loss Aversion
Central to the behavior of capital withdrawal is Prospect Theory, which posits that the psychological pain of a loss is twice as potent as the satisfaction derived from an equivalent gain. During the early stages of a conflict, as volatility spikes, investors often reach a "psychological threshold" where the fear of further losses overwhelms their long-term objectives. This results in "fear-based investing," a reactive state where positions are liquidated at or near market troughs simply to end the emotional stress of declining valuations. This behavior is often coupled with the "disposition effect," where investors hold losing positions too long in the hope of breaking even, only to panic and sell en masse when the news cycle worsens.
Herding and Information Cascades
In high-stress geopolitical scenarios, investors tend to ignore their own private signals and instead follow the actions of the broader market, a phenomenon known as "herd behavior". This "rational herding" occurs because, in an environment of total uncertainty, the perceived cost of being wrong while standing apart from the crowd is higher than the cost of being wrong alongside it. These movements create "information cascades," where a series of sell orders from institutional players triggers a wave of mimicking by retail investors, causing asset correlations to move toward 1.0 and rendering traditional diversification strategies ineffective in the short term.
Horizon-Dependent Risk Aversion and Ambiguity
Research into recursive utility suggests that risk aversion is not static but decreases as the investment horizon lengthens. During a conflict, the demand for "early resolution of uncertainty" becomes paramount. Investors are willing to pay a "timing premium" to move into liquid assets immediately, as the inability to predict the conflict's outcome creates a state of "ambiguity aversion"—a preference for known risks over unknown ones. This manifests in a "flight to liquidity," where even high-quality assets are sold to raise cash or move into government-backed reserve currencies.
The Transmission Mechanism: Energy, Inflation, and Yields
The extent to which a military conflict impacts global capital markets is largely determined by its effect on energy prices and the broader inflationary regime. Historically, conflicts that involve major oil-producing regions or strategic maritime chokepoints have the potential to transform a temporary pullback into a structural economic shift.
The Energy-Yield Pipeline
The mechanical link between geopolitical events and Treasury bond yields is mediated through the "Transmission Mechanism" of energy costs. Nearly every significant U.S. military engagement in the modern era has involved regions critical to global energy logistics, such as the Persian Gulf or the Strait of Hormuz, which facilitates twenty to thirty percent of seaborne oil trade. When a conflict threatens these supplies, the resulting spike in crude oil prices raises inflation expectations ("breakevens"), which in turn forces nominal Treasury yields higher.
Conflict Regime | Oil/Energy Impact | Treasury Yield Response | Fed/Policy Context |
World War II (1941) | Controlled | Yields pegged at 2.5% | Yield Curve Control |
Vietnam War (1964-73) | Inflationary | Yields rose 4.2% to 6.5% | Overheating Economy |
Gulf War (1990) | Transient Spike | Brief rise, then fell 80 bps | Post-1980 Disinflation |
9/11 Attacks (2001) | Deflationary | Yields fell 100 bps | Fed Easing/Flight to Safety |
Russia-Ukraine (2022) | Structural | Yields rose 2.0% to 5.0% | 40-year High Inflation |
The 2022 Russia-Ukraine conflict marked a significant departure from the post-1980 disinflationary trend. Because the invasion occurred while inflation was already at forty-year highs, the energy and commodity price shocks were structural rather than transient. This forced a dramatic repricing of fixed-income assets, with the ten-year yield surging as the market priced in more aggressive central bank intervention. This illustrates that wars do not drive Treasury yields in a vacuum; they act as the "ignition" for inflationary forces already primed by the existing macro regime.
Safe-Haven Asset Performance and Rotation
As capital exits equities and developing markets, it rotates predictably through a hierarchy of safe-haven assets. The relative attractiveness of these havens—gold, reserve currencies, and high-quality sovereign debt—often shifts as a conflict progresses from an acute shock to a protracted stalemate.
Traditional Havens: Gold, USD, and CHF
Gold remains the classic safe-haven asset, primarily valued for its intrinsic worth and resistance to monetary expansion or currency debasement. Historically, gold has averaged an 8.98 percent increase over the twelve months following the start of a conflict. During the 2024 Iran-Israel conflict, gold saw a significant 35.8 percent annual surge. However, its status can fracture during swift military resolutions; during "Operation Rising Lion" in 2025, gold fell 3.17 percent in the first week as equities rallied, reflecting its role as a form of "crisis insurance" that expires once certainty returns.
The Swiss Franc (CHF) has demonstrated the most consistent appreciation of any currency during global instability, strengthening against the U.S. dollar in 100 percent of analyzed conflicts. This reliability is rooted in Switzerland's political neutrality and robust financial system. In contrast, the Japanese Yen (JPY) has recently struggled to maintain its safe-haven status during conflicts that trigger oil price spikes, due to Japan's extreme dependence on energy imports and the resulting current-account pressures.
Asset Class | Performance Metric | 2022 Ukraine Conflict | 2024 Iran-Israel | 2025 "Rising Lion" |
Gold | 12-Month Return | N/A | +35.8% | -3.17% (Weekly) |
U.S. Dollar (DXY) | 6-Month Return | +11.9% | -5.7% | -0.30% |
Swiss Franc | Consistency | Strong Appreciation | +2.9% | +0.25% |
Bitcoin | 6-Month Return | -43.3% | +32.1% | +0.42% |
The Emergence of Digital Assets and Stablecoins
The role of Bitcoin during geopolitical crises remains a subject of intense debate. During the 2022 Russia-Ukraine war, Bitcoin behaved as a "risk-on" asset, plunging 43.3 percent in tandem with tech stocks. However, in subsequent conflicts, such as the 2024 strikes in Iran, it gained 32.1 percent over the following year, suggesting a "dual nature" that can alternate between speculative volatility and a safe-haven narrative.
Stablecoins, particularly those pegged to the U.S. dollar and backed by Treasuries, have emerged as a critical mechanism for capital preservation during wartime capital flight. By 2025, stablecoins were being used extensively in conflict zones to circumvent capital controls and facilitate international payments where traditional banking networks were restricted. Stablecoin issuers have also become significant holders of U.S. Treasuries, maintaining approximately US$160 billion in dollar-denominated debt by 2025, which reinforces the dollar's global dominance even as investors move into digital formats.
Winning Sectors: Strategic Capital Reallocation
While broad market indices may experience initial pullbacks, specific sectors consistently outperform during wartime due to demand surges, expanded government procurement, and defensive earnings characteristics.
Defense and Aerospace
The defense sector is the most direct beneficiary of military conflict. Large prime contractors operate with massive multi-year backlogs funded by government-guaranteed contracts. Historically, higher military spending has resulted in lower stock volatility for defense firms and related industries such as steel and electronics.
Key subsegments that attract capital include:
Precision Munitions and Missiles: Increased replenishment orders drive near-term revenue for firms like Lockheed Martin and RTX.
ISR and Space Systems: The demand for intelligence, surveillance, and reconnaissance (ISR) and resilient satellite communications spikes as situational awareness becomes a national security priority.
Cybersecurity: Modern conflicts involve significant cyber operations, accelerating procurement for vendors of threat intelligence and endpoint protection like CrowdStrike and Palo Alto Networks.
Energy and Strategic Commodities
Energy equities serve as a natural hedge against the geopolitical risk that drives oil and gas prices higher. Integrated majors like ExxonMobil and Chevron benefit from higher realized prices across upstream and refining operations. Additionally, the wider "energy-security" theme extends to service firms like Schlumberger and Halliburton, which benefit from drilling cycles as nations seek to diversify away from conflict-afflicted suppliers.
Ancillary and Defensive Sectors
Beyond direct defense, capital often flows toward sectors that provide stability and income. Utilities and consumer staples typically outperform cyclical equities in risk-off periods as investors prioritize predictable cash flows. Furthermore, military innovation often creates "spillover" benefits for civilian manufacturing and transportation, particularly in autonomous vehicles, drones, and AI-driven predictive maintenance.
Global Supply Chain Reconfiguration: Friend-Shoring and Scarcity
The 2022 invasion of Ukraine served as a definitive turning point for global production networks, exposing the extreme vulnerabilities of "just-in-time" supply chains that relied on autocratic regimes. This has triggered a structural shift toward "friend-shoring"—relocating production and sourcing to countries that share similar values and political interests.
Agricultural Disruptions and Rerouting
The market concentration of agricultural exports in the Black Sea region created fundamental vulnerabilities. Russia and Ukraine together accounted for approximately twenty-five percent of global wheat and barley exports and sixty percent of sunflower seed oil. The conflict resulted in global wheat prices jumping fifty-five percent in the weeks following the invasion.
Commodity | Ukraine Production Decline | Price Spike (March 2022) | Global Impact |
Wheat | -26% | +24.53% | Critical Food Security Risk |
Maize | -21% | +14.66% | Supply Chain Inflation |
Soybeans | -32% | +8.91% | Feed/Industrial Disruption |
Sunflower Oil | Severely Blocked | N/A | 60% of Global Export at Risk |
To mitigate these risks, nations are shifting toward strategic stockpiling and local production support, particularly in developing economies like sub-Saharan Africa, which are most at risk from Black Sea disruptions. Alternative export corridors have emerged through Kazakhstan and Belarus, which have seen a thirty percent trade diversion as they facilitate the rerouting of Russian exports.
The Geopolitical Reordering of Manufacturing
Friend-shoring introduces a "trusted trade partner" dimension to supply chain management, moving away from purely economic efficiency. The U.S. and its allies have increasingly focused on reducing dependency on authoritarian regimes for critical inputs like semiconductors and rare earth minerals. This has led to the formation of coalitions such as the Minerals Security Partnership (MSP), which aims to secure supplies of cobalt, lithium, and nickel among allied nations like Canada, Japan, and the EU.
While onshoring (bringing production home) is often cost-prohibitive, friend-shoring in countries like India, Vietnam, and Malaysia offers a pragmatic middle ground, providing lower labor costs while reducing the risk of political blackmail or economic coercion.
Safe-Haven Jurisdictions and Capital Relocation
For internationally mobile investors, protecting wealth during global conflict often involves the physical or legal relocation of assets to jurisdictions that offer political neutrality, transparent governance, and robust legal protections.
Singapore: The Stable Institutional Choice
Singapore has positioned itself as the "stable choice" for global investors, offering a pro-business environment and transparent institutions. It is particularly attractive for multinational headquarters due to its International Headquarters (IHQ) Programme, which can bring the effective corporate tax rate down to five or ten percent on qualifying income. Unlike "paper structures," Singapore requires "real substance"—headcount and genuine decision-making—which aligns with evolving OECD standards.
Dubai: The Hub for Mobility and Asset Protection
Dubai has emerged as a premier destination for wealth preservation, offering zero personal income tax and a sophisticated legal framework for property ownership through foundations and holding companies. The introduction of the Golden Visa has further incentivized long-term residency for investors and entrepreneurs. For mobile families, the UAE provides a base from which to achieve "jurisdictional diversification," holding financial assets across multiple international banking centers to reduce exposure to the regulatory or political risks of any single country.
Institutional Risk Assessment: The MACRI Framework
Institutional investors and policymakers increasingly rely on standardized metrics to quantify the "unquantifiable" risks of geopolitics. Moody’s Analytics Country Risk Index (MACRI) is a primary tool for this purpose, aggregating Threats across six dimensions into a single score from 0 to 100.
Dimensions of Risk Assessment
The MACRI framework utilizes a vector of quantitative and qualitative indicators to monitor threats to macrofinancial stability:
Political Risk: Reflects policy uncertainty and the stability of the government, utilizing the Political Stability Index and the "Voice and Accountability" metric from the World Bank.
Security Risk: Assesses direct threats to property and human life from war, terrorism, and geopolitical instability.
Financial Risk: Monitors balance sheet vulnerabilities, including foreign exchange (FX) volatility and leading indicators of banking or currency crises.
Social Risk: Evaluates the potential for large-scale social upheaval through indicators like the Gini Index (inequality) and adult literacy rates.
These scores allow institutions to perform "stress testing" on their portfolios, identifying which exposures are most sensitive to a sudden "correlation breakdown" where historical diversification fails.
Portfolio Resilience: Strategic vs. Tactical Allocation
Navigating wartime volatility is ultimately a challenge of asset allocation and discipline. The distinction between strategic and tactical horizons is essential for preventing the emotional, reactive decisions that lead to permanent capital impairment.
The Strategic Blueprint
Strategic Asset Allocation (SAA) acts as a portfolio's long-term compass, setting targets across major asset classes—equities, fixed income, and private markets—based on an investor's unique goals and risk tolerance. Because SAA is designed to weather entire market cycles, it typically ignores short-term disturbances. Through regular rebalancing, SAA compels investors to "buy low and sell high" by trimming exposure to outperforming assets (like gold during a spike) and adding to those that have dipped (like broad equities).
Tactical Tilts and Opportunities
Tactical Asset Allocation (TAA) is a more responsive approach, involving deliberate, short-to-medium-term shifts (typically three months to a year) to capitalize on market dislocations. TAA might involve overweighting defense or energy sectors when a conflict begins, or moving to cash during a projected slowdown. However, the effectiveness of TAA lies in its role as a supplement to—not a replacement for—a strategic plan. The most common pitfall for investors is allowing tactical reactions to headlines to become their default strategy, which frequently results in buying high and selling low.
Comprehensive Analysis of Investment Patterns
The historical and behavioral evidence synthesized in this report reveals that the "wartime pullback" is a predictable cycle of uncertainty-driven volatility followed by risk-based recovery. While the initial reaction of capital is flight, it is not a flight away from all investment, but a strategic reallocation toward certainty, scarcity, and safety.
Summary of Cross-Asset Wartime Dynamics
Asset/Sector | Initial Reaction (Phase 1) | Mid-Conflict Behavior (Phase 2) | Long-Term Outcome (Phase 3) |
Equities (Broad) | Pullback (-6% avg) | Stabilization/Rebound | Often outperformance |
Defense Stocks | Immediate Surge | Consistent Resilience | Multi-year growth |
Gold | Initial Hedge (+0.3%) | Inflation Hedge (+8.9%) | Return to mean |
U.S. Treasuries | Flight to Safety | Yields follow Oil/Inflation | Regime-dependent |
Energy/Oil | Price Spike | Structural Volatility | Margin expansion |
Developing Markets | Capital Flight | Refinancing Stress | Currency depreciation |
The modern investor must recognize that the "Transmission Mechanism" of geopolitical risk has evolved. In a world defined by structural inflation and great-power competition, the resilience seen in the post-1980 era of disinflation can no longer be taken for granted. The shift toward friend-shoring, the rise of stablecoins as a tool for capital flight, and the institutionalization of geopolitical risk modeling through tools like MACRI are all indicators of a more complex and permanent reconfiguration of global finance.
By aligning tactical responses with a robust strategic blueprint, and by prioritizing "real substance" in jurisdictional selection, investors can not only protect their capital during conflicts but also position themselves to benefit from the industrial and technological accelerations that wars frequently, if tragically, catalyze. The primary lesson of the last century is that markets do not fear conflict so much as they fear the unknown; once the unknown is priced, the engine of capital allocation resumes its course
Startup Guides, Founder Lessons, and Real Insights from the Startup World
Building a startup is exciting, chaotic, and often misunderstood. If you’ve ever wondered how founders actually validate ideas, find co-founders, raise funding, and survive the emotional rollercoaster, these articles explore the realities behind the startup world.
Start with How to Validate Your Startup Idea in 48 Hours for $0 to understand how founders test ideas quickly before wasting months building the wrong product. Once you have an idea, the next challenge is building it—From Idea to MVP: A Step-by-Step Guide for Solo Founder walks through the journey from concept to a real product.
Many founders struggle with partnerships and team decisions. Should your co-founder live in the same city? Explore Remote vs. Local: Does Your Co-Founder Need to Live in the Same City? and learn the risks hidden in partnerships in 5 Red Flags to Look for When Choosing a Startup Partner. If you’re searching for technical help, How to Find a Technical Co-Founder (Without a Six-Figure Salary) explains how founders actually do it.
The startup journey isn’t just about building products—it’s also about mindset and decision-making. Articles like Decision Fatigue: The Silent Startup Killer, Fear vs Logic: How Founders Actually Make Decisions, and How Overthinking Destroys Early Momentum reveal the psychological battles founders face behind the scenes.
Growth is another misunderstood part of startups. Learn why strategy matters more than hype in Ideas Don’t Scale. Systems Do. and why discipline matters in Why Your Startup Doesn’t Need Growth — It Needs Focus. Discover the importance of early traction in How the First 100 Users Decide Your Startup’s Fate and understand team building through The First Hire That Actually Matters.
Funding is often romanticized, but reality is more complex. Why First-Time Founders Should Avoid Big Funding challenges common assumptions about venture capital, while Revenue Solves More Problems Than Funding explains why sustainable businesses matter more than investor money.
The startup ecosystem also varies by geography. If you're curious about India’s startup scene, explore The New Playbook for Raising in Bangalore, Why Raising Pre-Seed in Bangalore Is Harder Than Ever, and Why B2B SaaS from Bangalore Scales Faster.
But startups are not just about strategy and growth—they’re also about people and emotions. Articles like The Hidden Burnout of Bangalore Founders, Comparison Culture in India’s Startup, and The Loneliness of First-Time Founders in Bangalore reveal the personal struggles founders rarely talk about publicly.
And finally, if you want a deeper perspective on the startup journey itself, explore Lessons Learned Too Late by First-Time Founders and The Myth of the “Overnight Success” Startup—because the truth behind startup success is far more complex than it appears.