The Rise of “AI” in US Companies
June 22, 2026 by Sheikh Mohammad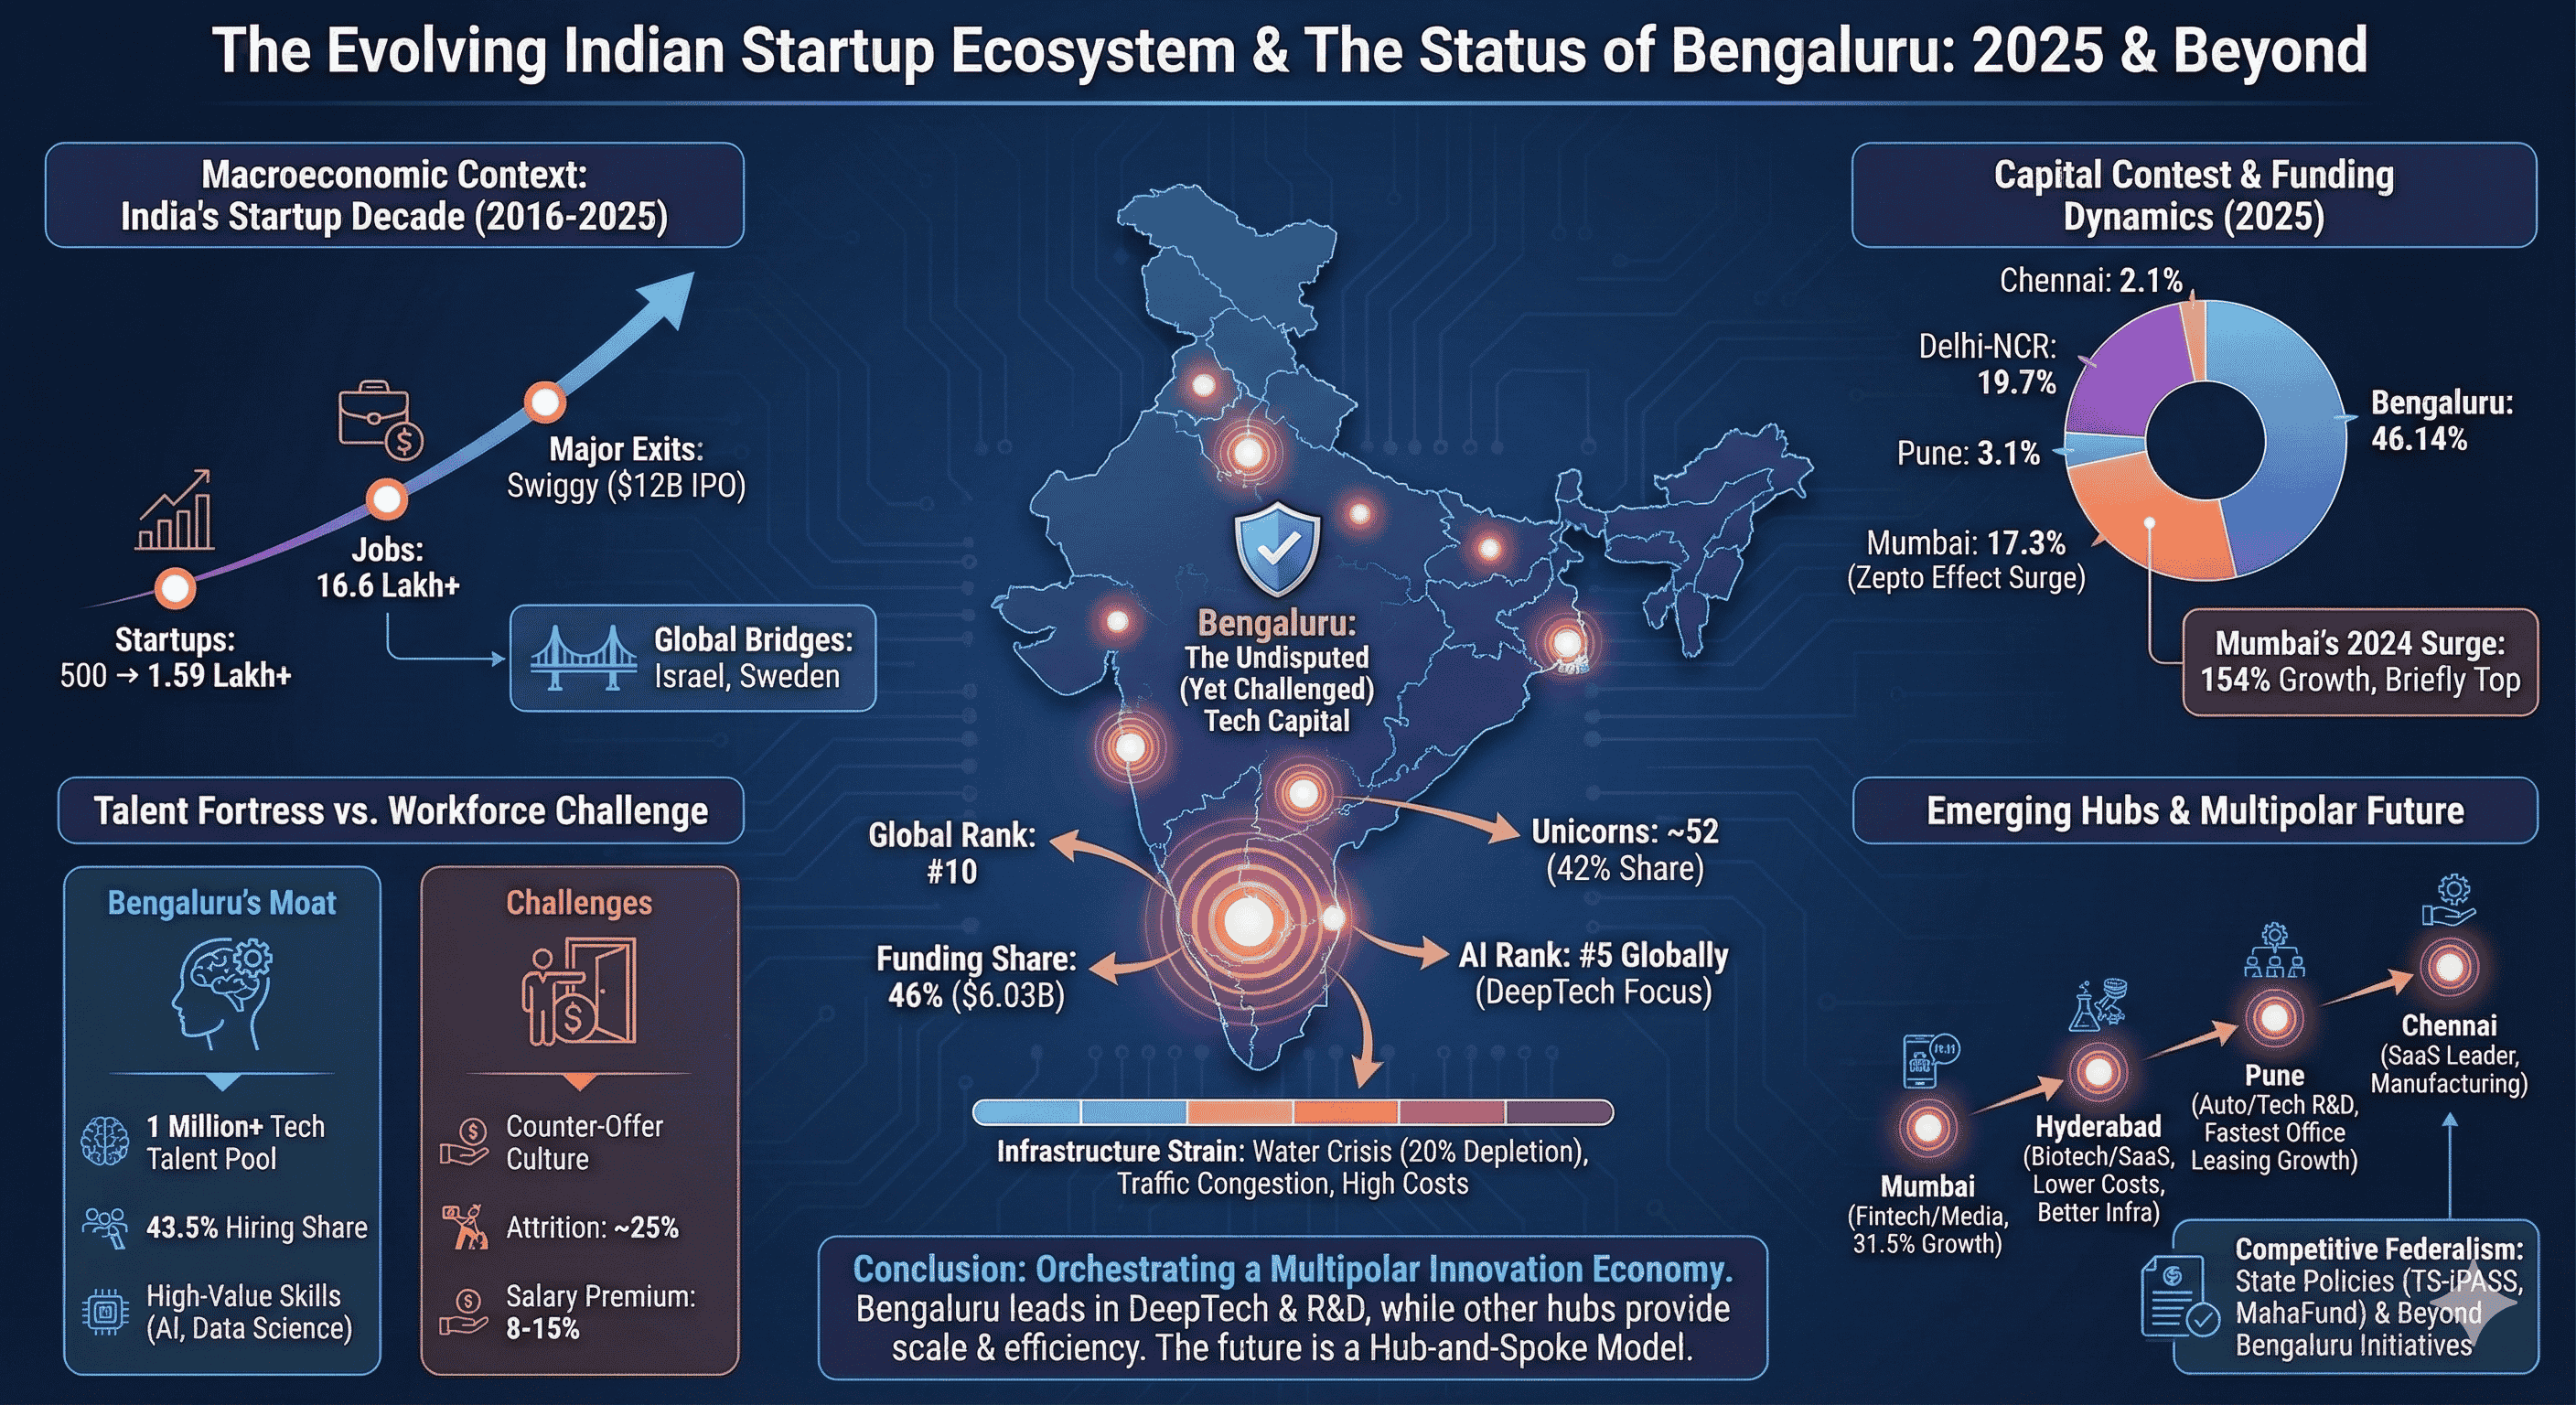
The evolution of the Indian startup ecosystem has reached a critical juncture in 2025, moving from a period of unbridled, capital-fueled expansion toward a disciplined era of operational maturity, profitability, and structural consolidation. Within this shifting paradigm, the status of Bengaluru as the nation’s preeminent technology hub—long termed the "Silicon Valley of India"—is undergoing a rigorous re-evaluation. While the city continues to command the largest share of venture capital, talent density, and unicorn creation, the rising competitive gravity of Mumbai, Delhi-NCR, and Hyderabad, coupled with severe infrastructural bottlenecks, has sparked a debate over whether its capital status remains "undisputed". As the ecosystem matures, the resilience of Bengaluru’s innovation moats is being tested by a combination of macroeconomic shifts, environmental stress, and the strategic decentralization policies of competing state governments.
The Macroeconomic Landscape: India’s Startup Decade in Review
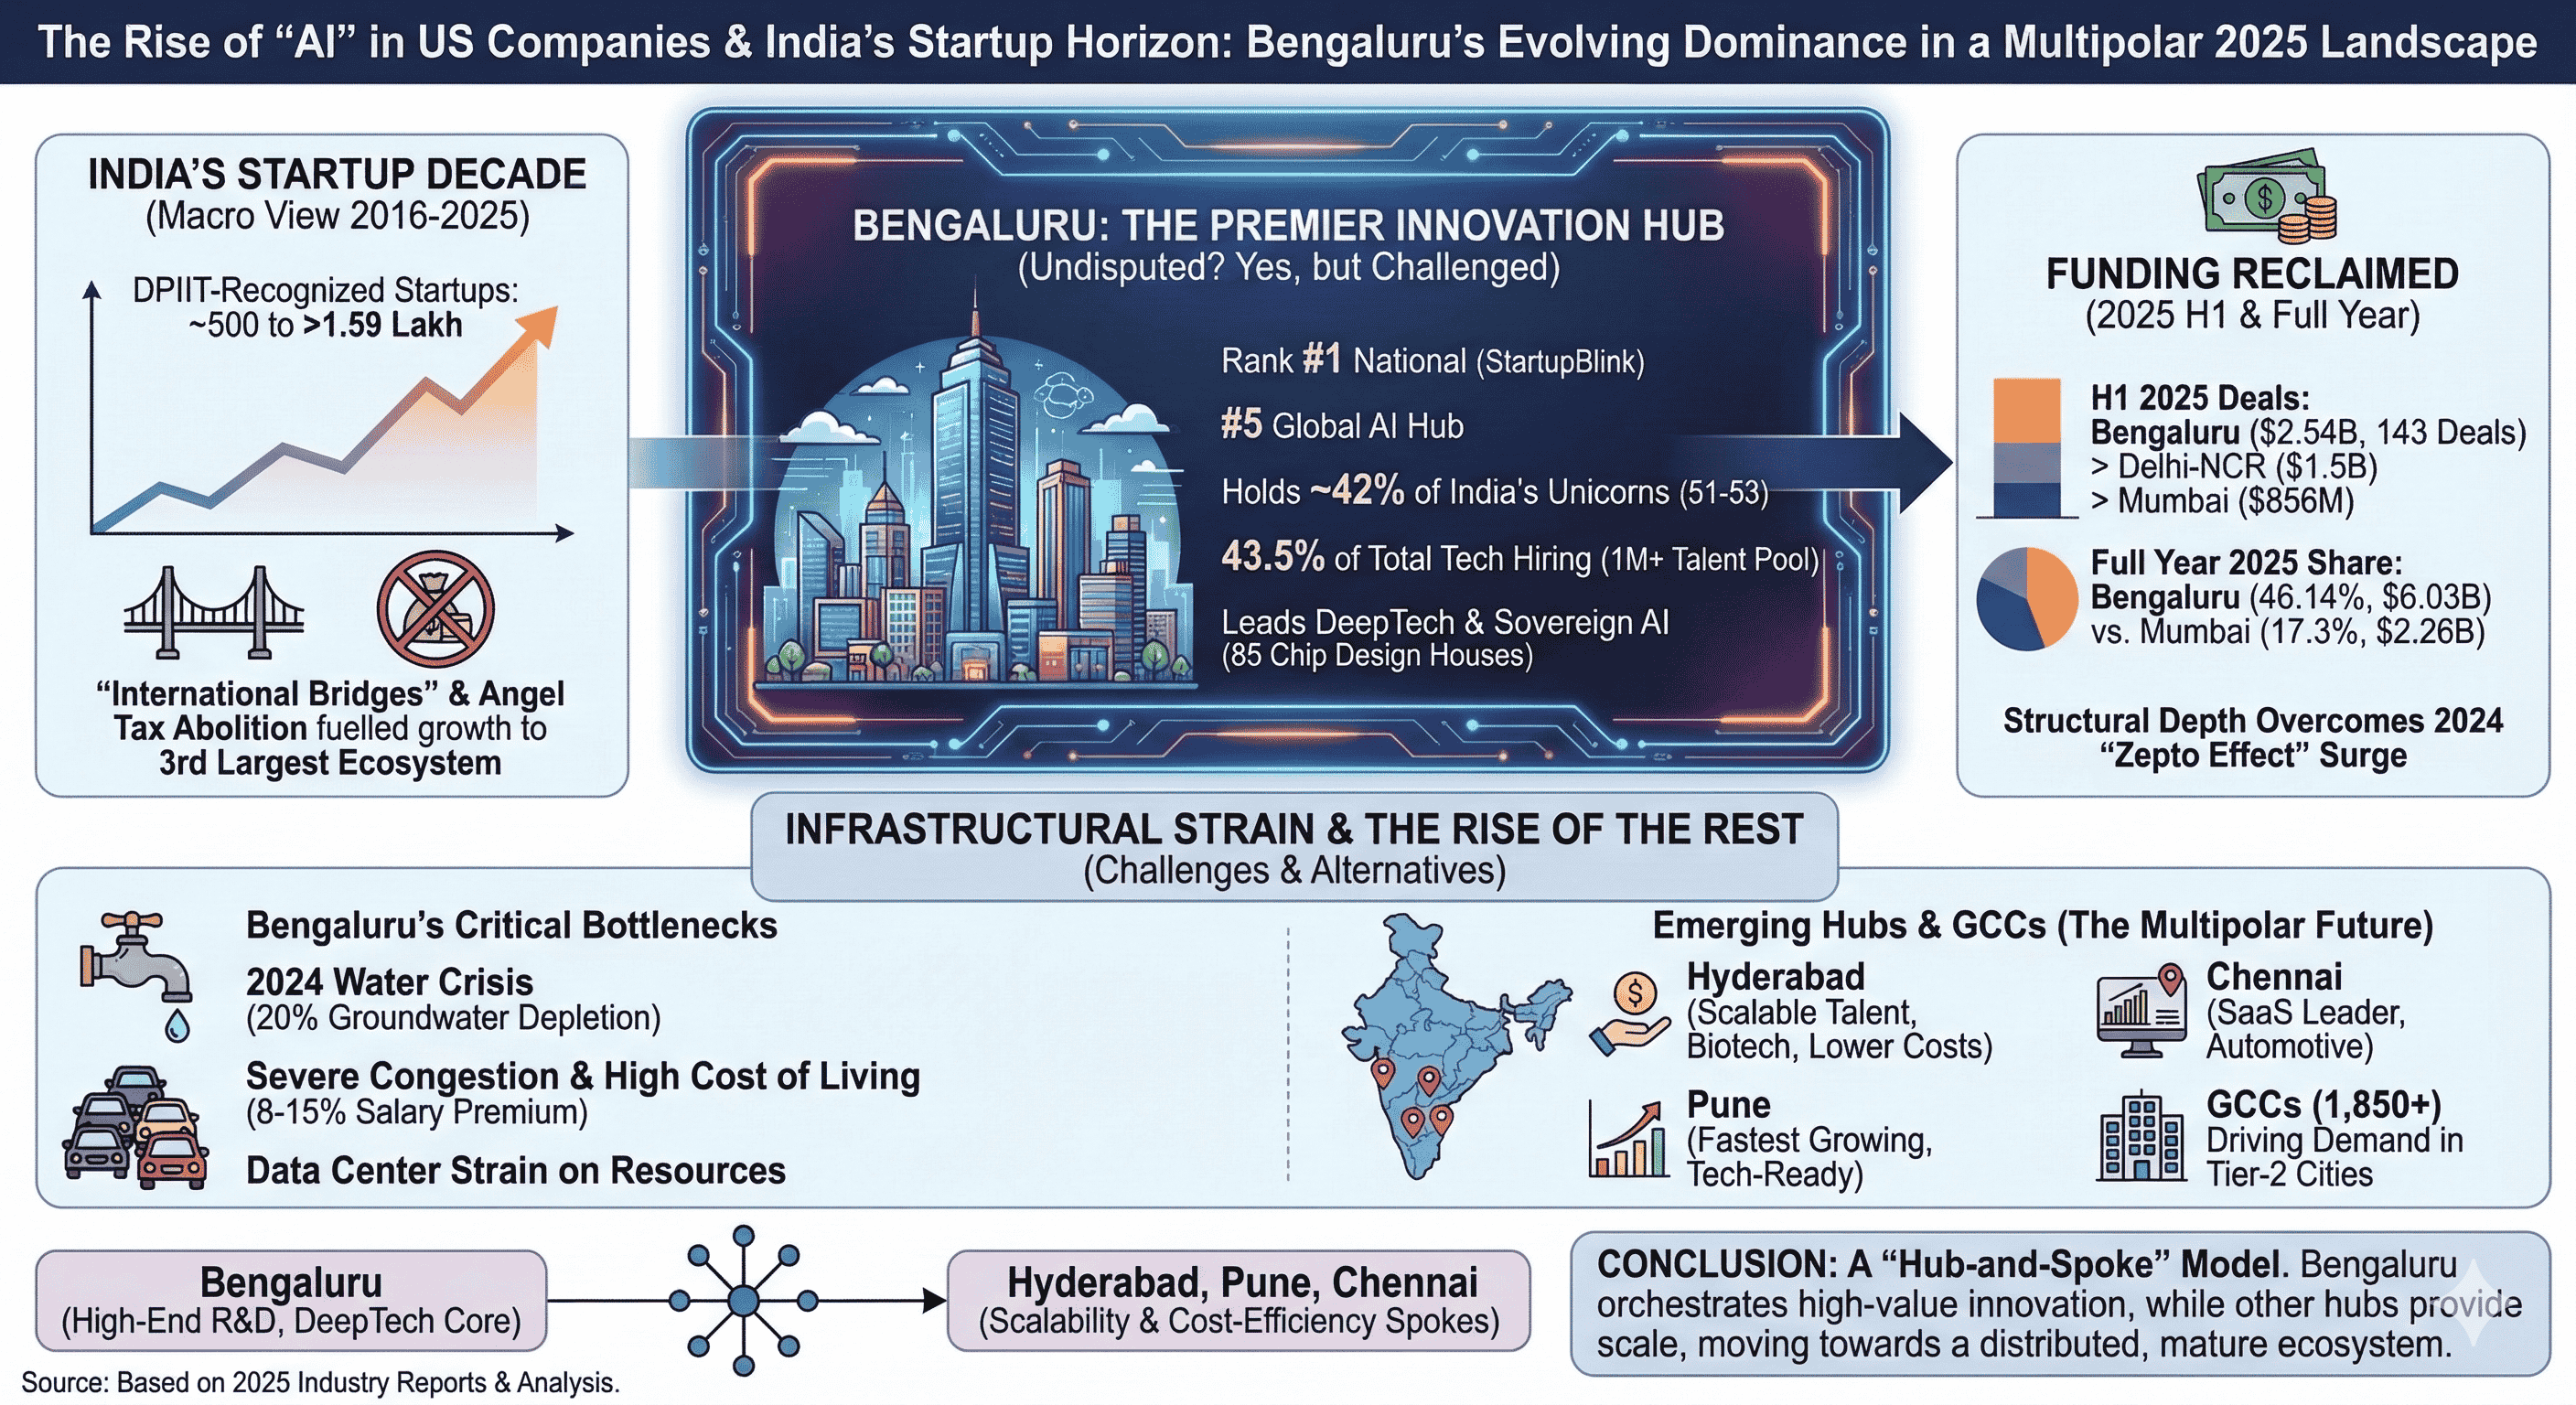
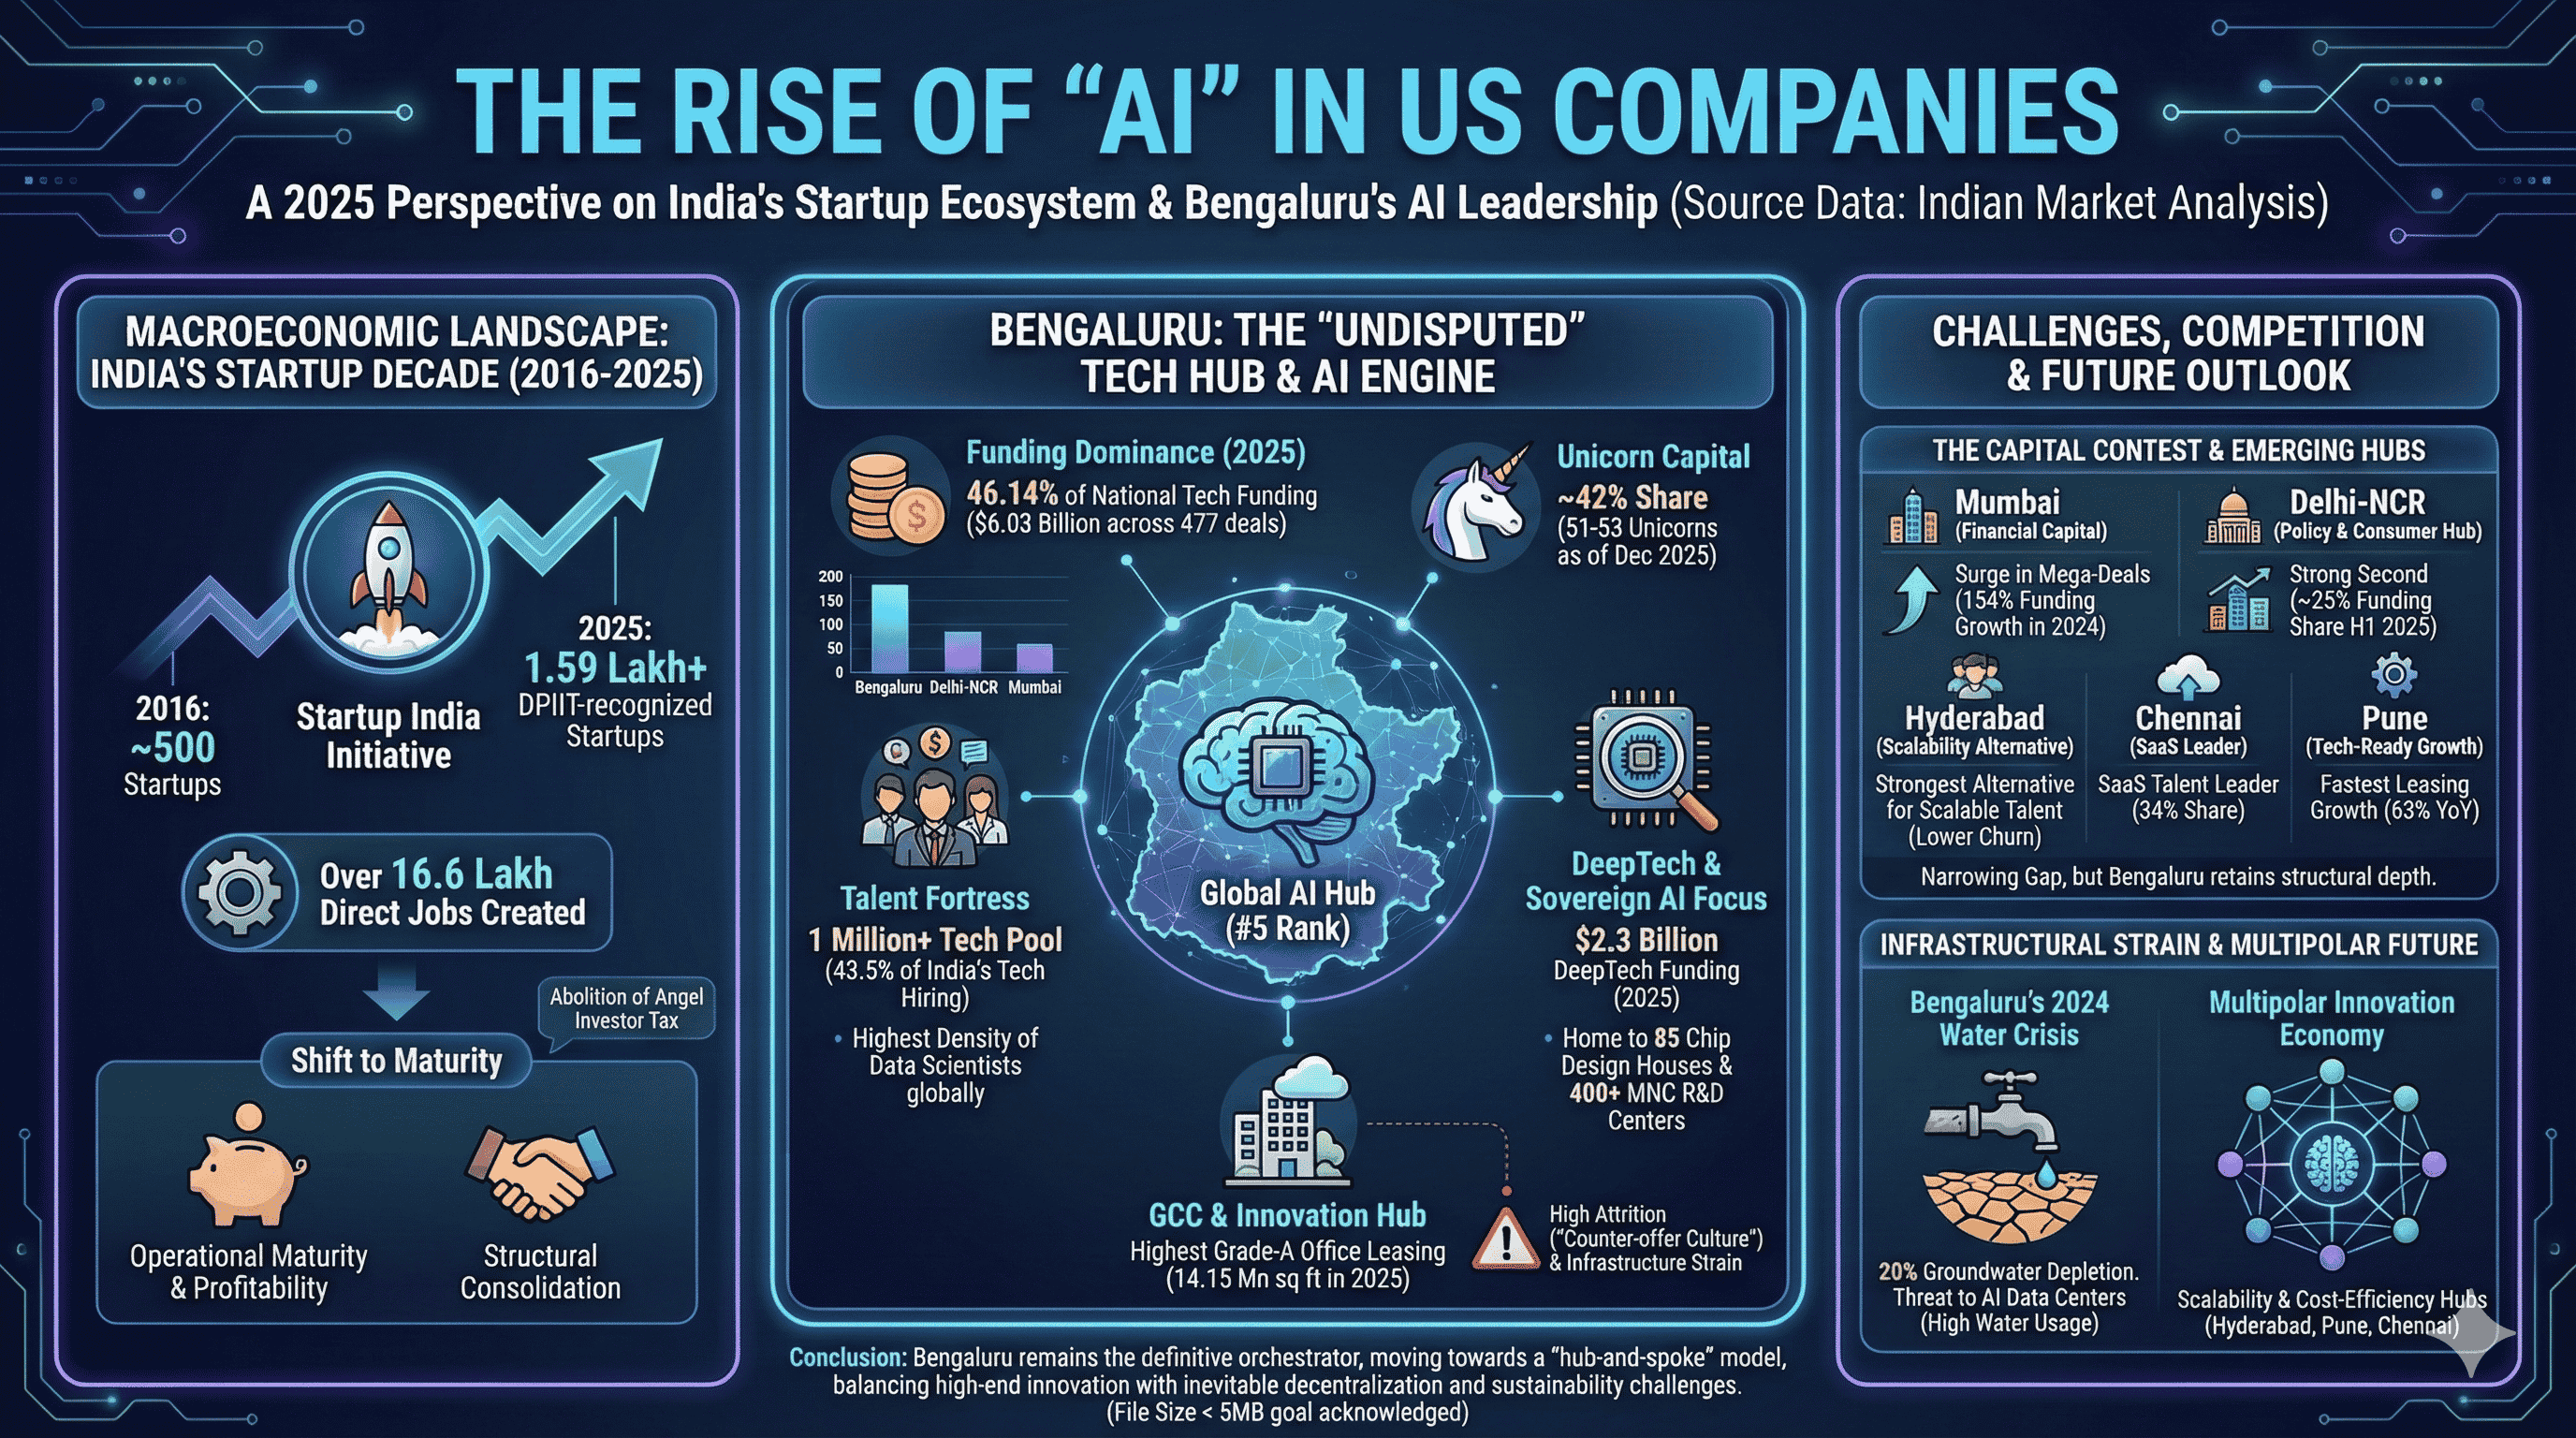
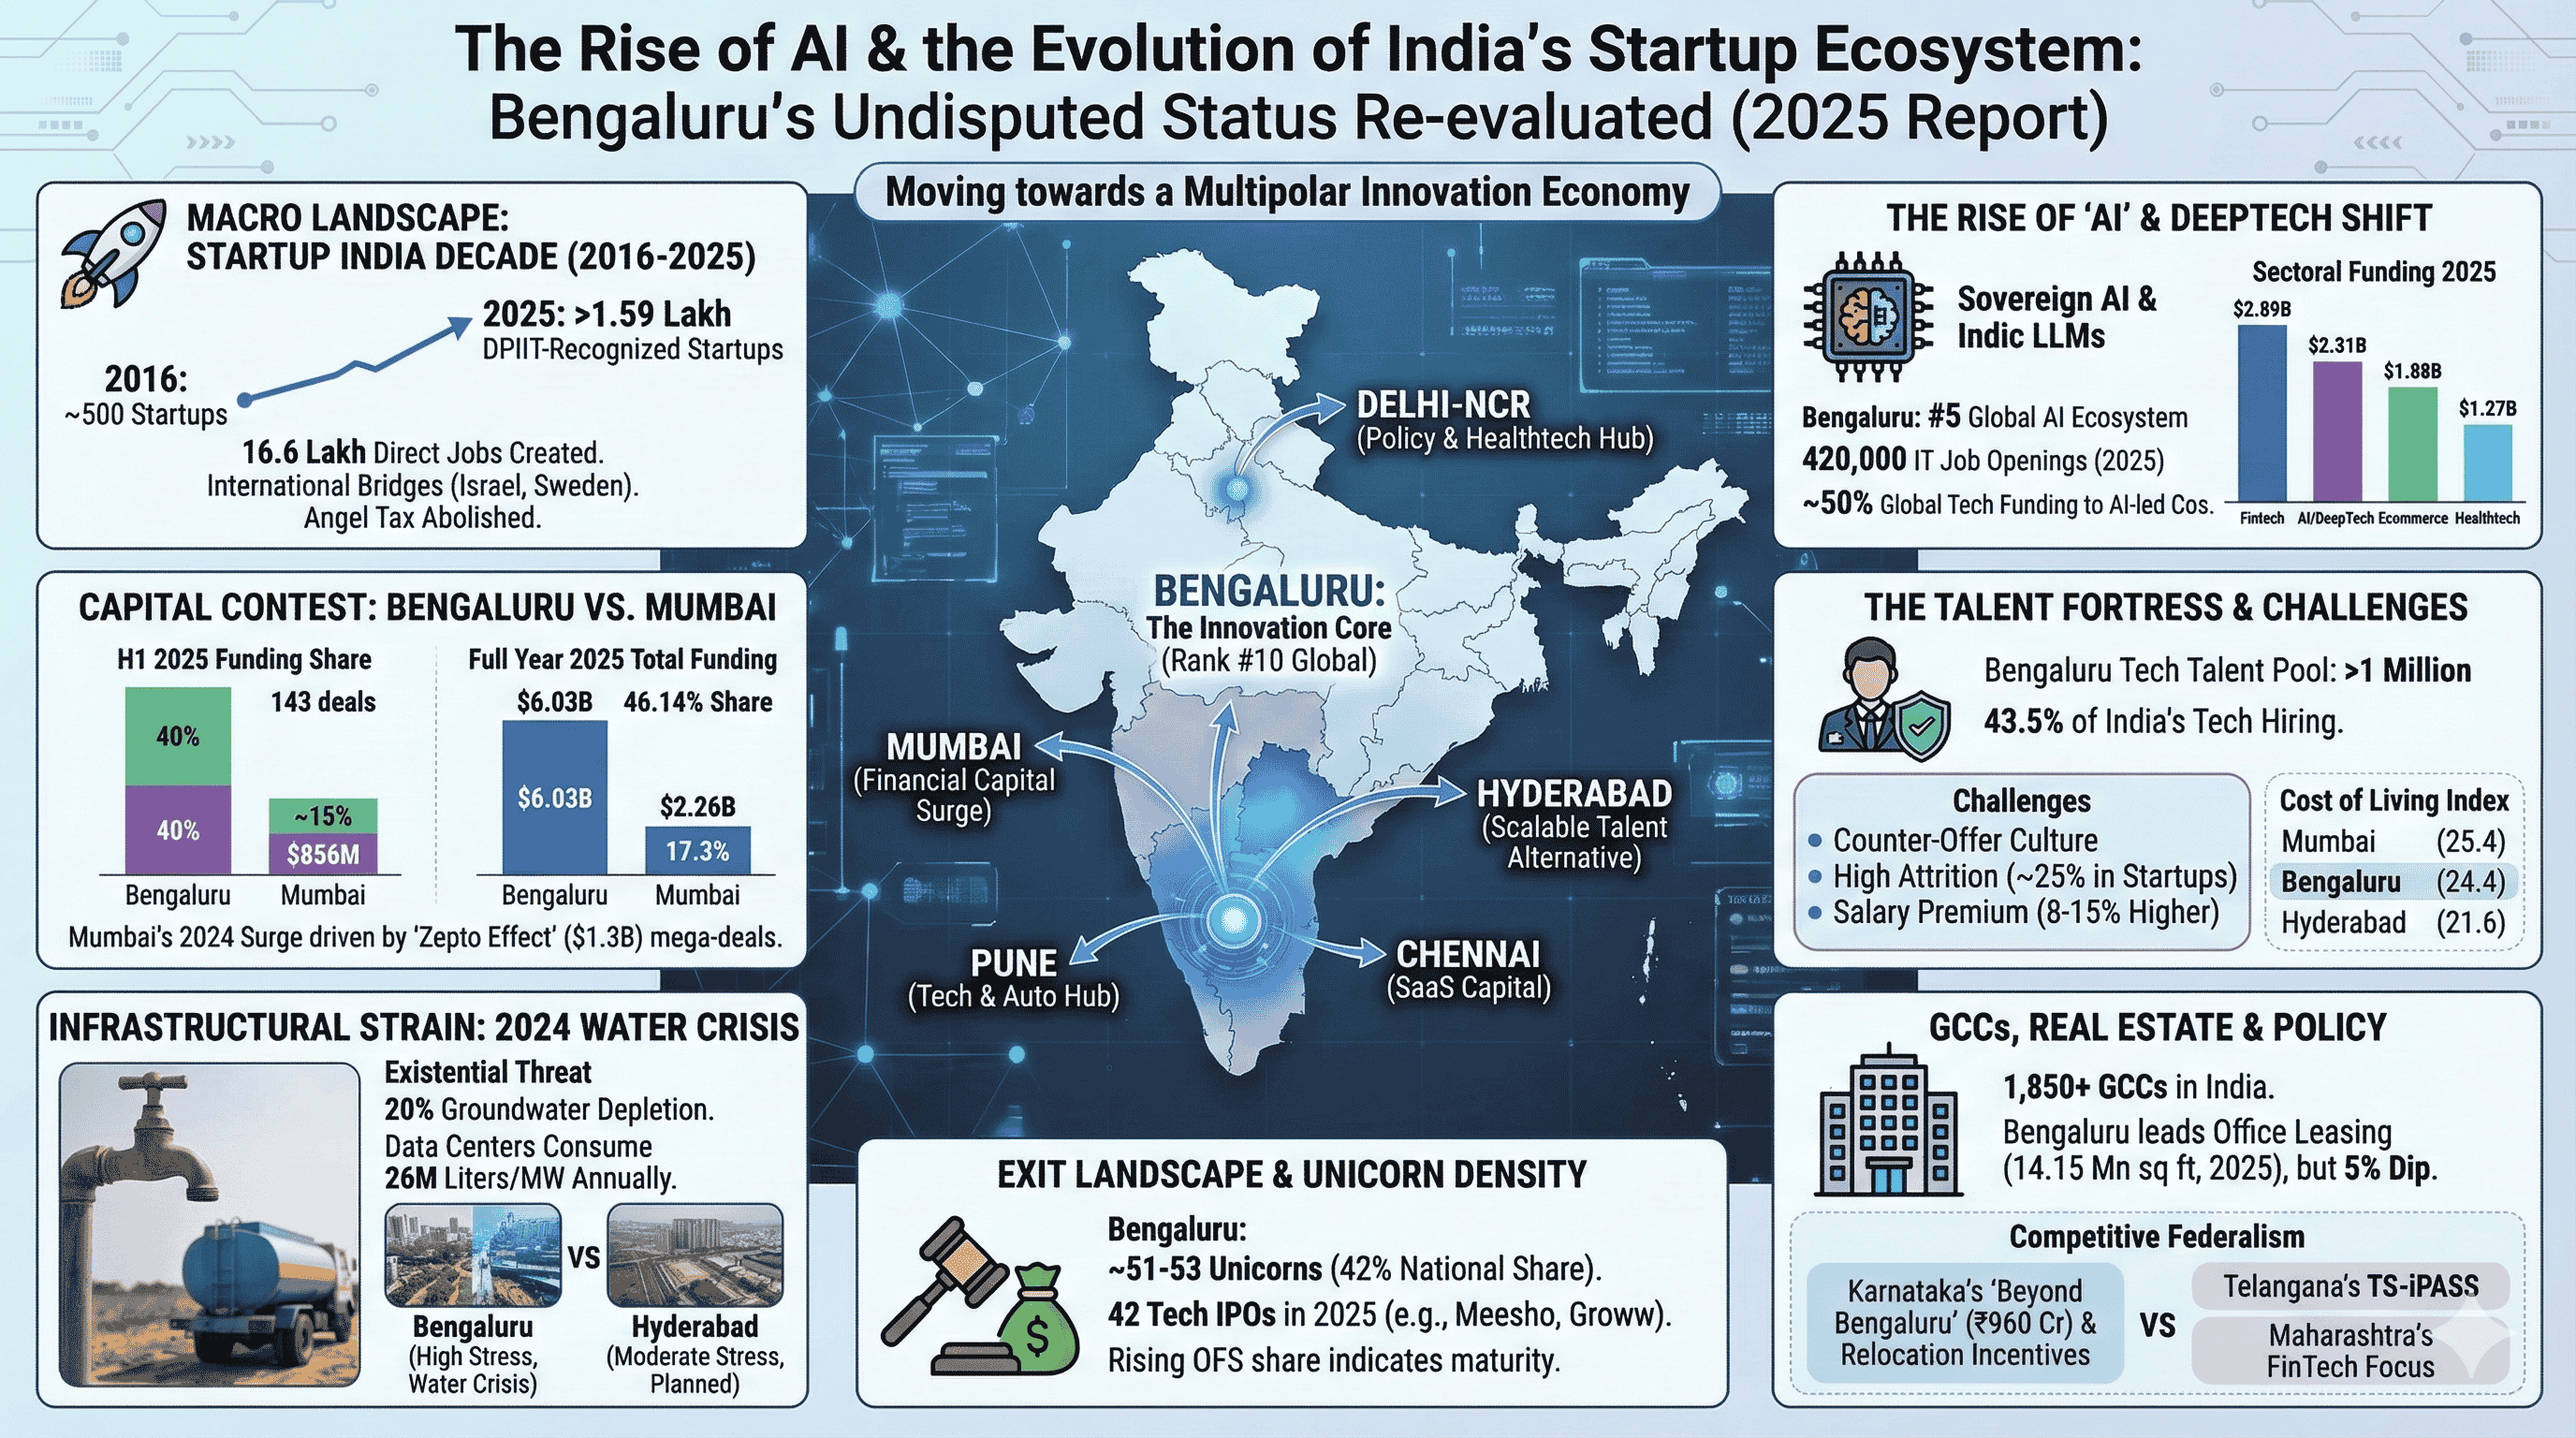
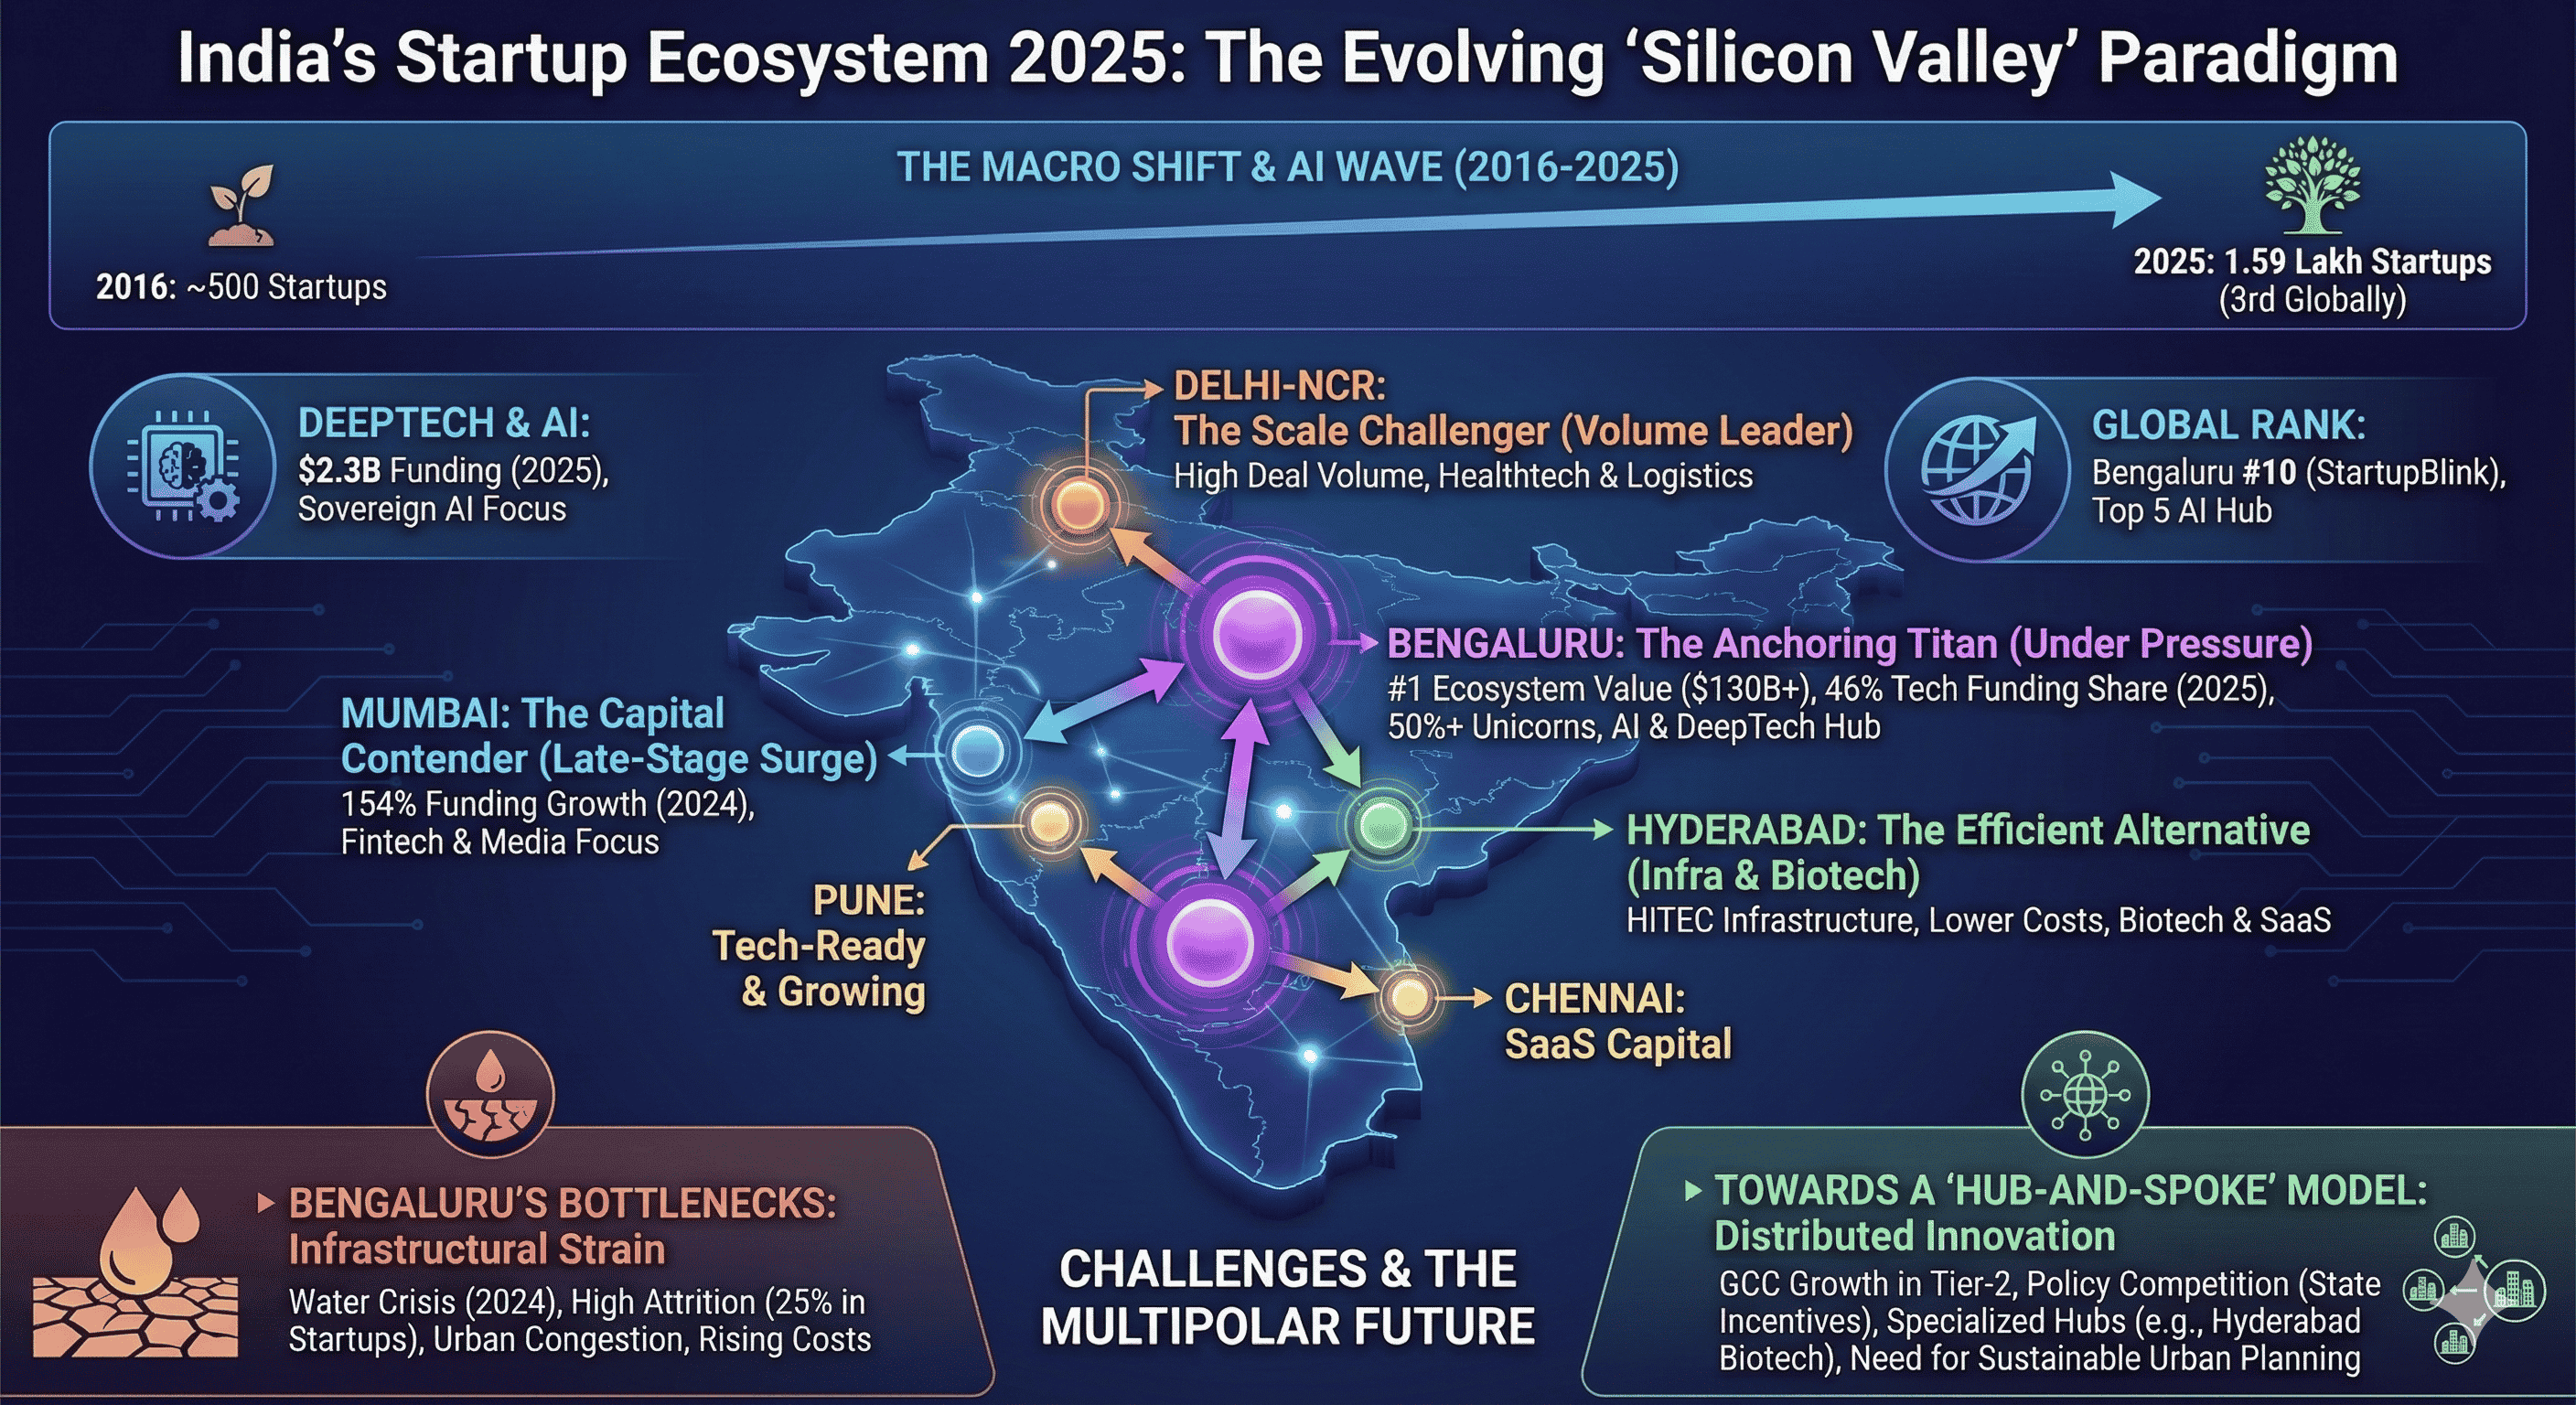
The year 2025 marks a decade of the Startup India initiative, a milestone that reflects the nation’s journey toward becoming the world’s third-largest startup ecosystem. Since 2016, the number of DPIIT-recognized startups has surged from approximately 500 to over 1.59 lakh as of January 2025, creating more than 16.6 lakh direct jobs. This transformation has been underpinned by the "International Bridges" program, connecting Indian entrepreneurs with global hubs in Israel and Sweden, and the abolition of the angel investor tax, which removed a significant financial burden on early-stage ventures.
Bengaluru has served as the primary engine of this growth. In the Global Startup Ecosystem Report 2025, the city climbed seven spots to rank 14th worldwide, cementing its transition from a "rising star" to a top-tier global innovation powerhouse. This leap was primarily driven by high-value exits exceeding $1 billion in 2024, most notably the $12 billion valuation of Swiggy.com. Nationally, Bengaluru maintains its first-place position in the StartupBlink Ecosystem Index, despite a slight decline in its global rank to 10th place due to faster-moving ecosystems in Shanghai and Paris.
Comparative National Ecosystem Rankings and Growth Rates 2025
National Rank | City | Global Rank | Annual Ecosystem Growth | Total Ecosystem Score |
1st | Bengaluru | 10th | 13.8% | 77.567 |
2nd | New Delhi | 11th | 15.5% | 64.328 |
3rd | Mumbai | 18th | 31.5% | 48.451 |
4th | Hyderabad | 70th | 12.0% | 11.916 |
5th | Pune | 79th | 13.3% | 10.849 |
6th | Chennai | 88th | 6.7% | 9.992 |
7th | Ahmedabad | 132nd | 11.2% | 6.576 |
Sources:
The data suggests a narrowing gap between the top three hubs. While Bengaluru remains the undisputed leader in total score, Mumbai’s growth rate of 31.5%—the highest among major Indian cities—indicates a rapid acceleration in capital mobilization and deal activity.
Dissecting the Capital Contest: Funding Dynamics and the Mumbai Surge
The narrative of Bengaluru’s dominance faced a significant challenge in 2024 when Mumbai briefly dethroned it as India’s top startup funding destination. Mumbai’s funding skyrocketed by 154% year-on-year, jumping from $1.5 billion in 2023 to $3.7 billion in 2024. This shift was largely attributed to the "Zepto effect," where the quick-commerce unicorn raised over $1.3 billion across three separate rounds, accounting for 37% of Mumbai’s total funding. This demonstrated Mumbai’s unique appeal for late-stage mega-deals, leveraging its position as the country's financial capital to attract massive private equity and venture capital inflows.
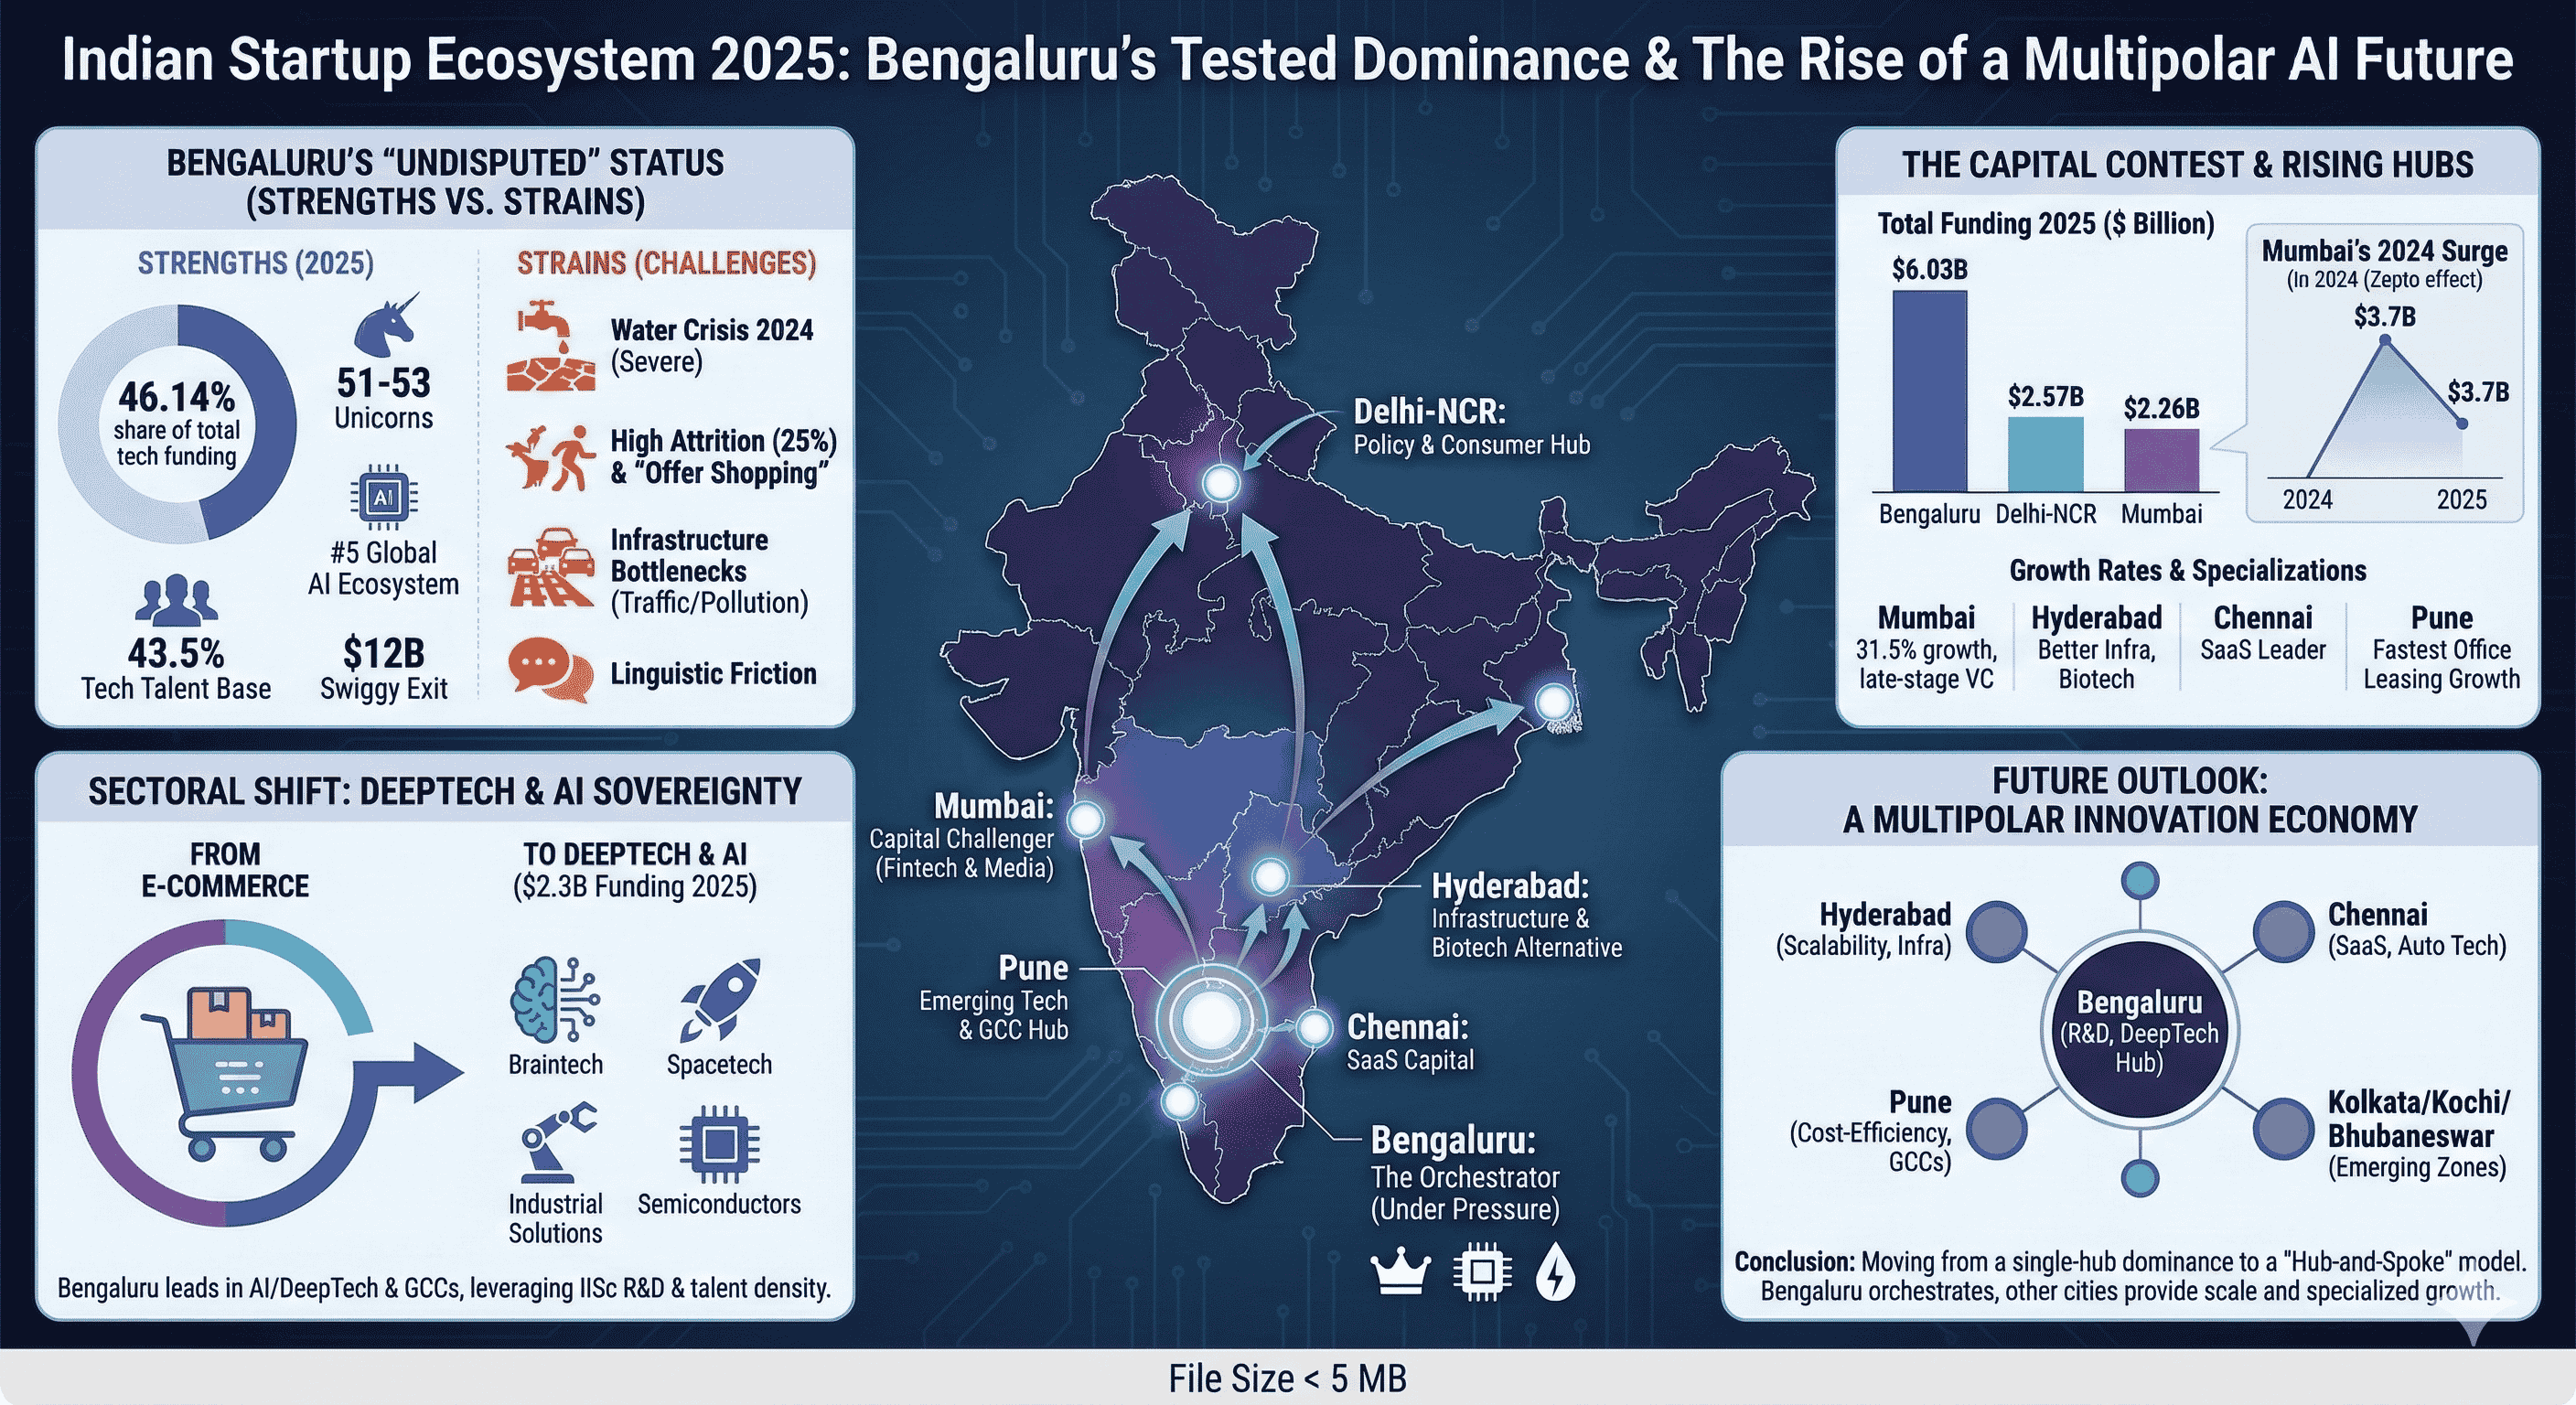
However, the 2025 data reveals a restoration of Bengaluru’s primacy in terms of both deal volume and total capital raised over a longer time horizon. In the first half (H1) of 2025, Bengaluru secured $2.54 billion across 143 deals, outpacing Delhi-NCR ($1.5 billion across 116 deals) and Mumbai ($856 million across 80 deals). By the end of 2025, Bengaluru accounted for 32% of total tech funding, followed by Mumbai at 18%.
Detailed Funding Breakdown by City and Deal Volume 2025
Hub | Total Funding (Full Year 2025) | Total Deals | Share of National Funding | Share of Deal Value (H1) |
Bengaluru | $6.03 Billion | 477 | 46.14% | 40% |
Delhi-NCR | $2.57 Billion | 301 | 19.7% | ~25% |
Mumbai | $2.26 Billion | 182 | 17.3% | ~15% |
Pune | $409.43 Million | 51 | 3.1% | ~5% |
Chennai | $281.91 Million | 53 | 2.1% | ~4% |
Sources:
Bengaluru’s share of total funding actually increased in 2025, rising from 35.08% in 2024 to 46.14%. This suggests that while individual mega-rounds can temporarily tilt the scales toward Mumbai or Delhi, the structural depth of Bengaluru’s ecosystem—spanning from seed-stage ideation to post-IPO secondary exits—ensures a more consistent and higher-volume flow of capital.
The Talent Fortress: Density, Depth, and the Workforce Challenge
The primary pillar of Bengaluru’s "undisputed" status is its unparalleled talent density. The city’s technology talent pool has crossed the one-million-professional mark, making it one of the largest and most specialized tech clusters globally. Bengaluru currently accounts for 43.5% of India’s total tech hiring, posting 420,000 IT job openings in 2025 alone. This concentration of human capital is particularly pronounced in high-value sectors; Bengaluru leads the world in the concentration of data scientists and ranks 5th globally in AI and Big Data ecosystems.
However, this density has created a hyper-competitive labor market characterized by a "counter-offer culture" and high attrition. Salary levels in Bengaluru for tech roles are generally 8-15% higher than in other Indian metros. While the IT sector's voluntary attrition saw a decline to approximately 15.1% in 2024, the tech startup segment remains elevated at 25%, with employees frequently "offer shopping".
Talent Acquisition and Labor Dynamics Comparison 2025
Market | Talent Acquisition Score | Overall Score | Tech Talent Base (%) | Salary Premium |
Bengaluru | 4.5 | 3.4 | 43.5% | 8-15% Higher |
Hyderabad | 4.0 | 2.6 | ~20% | Baseline |
Delhi-NCR | 3.5 | 2.4 | ~15% | Competitive |
Mumbai | 3.0 | 2.3 | ~10% | Competitive |
Pune | 2.5 | 2.6 | ~5% | Lower |
Sources:
Despite the high costs, global firms continue to anchor their operations in Bengaluru due to the "mature leadership base" and the availability of niche skills in system architecture, DevOps, and platform engineering. Hyderabad has emerged as the strongest alternative for scalable, predictable talent, offering a younger workforce (under-25) and lower churn rates. Chennai, meanwhile, has carved out a unique position as the "SaaS talent leader," hosting 34% of the nation’s SaaS professional base.
Sectoral Specialization: The Shift to DeepTech and Sovereign AI
In 2025, the Indian startup ecosystem transitioned from an ecommerce-centric model to one dominated by DeepTech, AI, and industrial solutions. Bengaluru has been the primary beneficiary of this shift. DeepTech funding in India reached $2.3 billion in 2025, reflecting a surge in patent-heavy ventures led by PhDs and former engineers from ISRO and DRDO. Bengaluru’s structural moats—including 85 chip design houses and more than 400 multinational R&D centers—make it the natural hub for this "strategic innovation" wave.
The rise of AI has further cemented Bengaluru’s lead. Nearly half of global tech startup funding in 2025 went to AI-led companies, and Bengaluru has positioned itself as the #5 AI ecosystem globally. The city is no longer just a service delivery center but a hub for "Sovereign AI" infrastructure, with investors prioritizing AI agents and Indic-language LLMs (though global models like GPT continue to lead in adoption).
Sector-wise Funding and Growth Performance 2025
Sector | Total Funding 2025 | Deal Count | Top Hub | Emerging Trend |
Fintech | $2.89 Billion | 154 | Bengaluru (42%) | Shift to Payments & WealthTech |
Ecommerce | $1.88 Billion | 176 | Bengaluru | Quick Commerce Dominance |
AI / DeepTech | $2.31 Billion | 113 | Bengaluru | Commercial Readiness over Tech |
Healthtech | $1.27 Billion | 100 | Delhi-NCR | AI-led platforms & Diagnostics |
SaaS | $1.15 Billion | 88 | Chennai | Profitability-first Narratives |
Spacetech | $245 Million | 12 | Bengaluru / Hyderabad | Defensive IP & R&D |
Sources:
While Bengaluru leads in most categories, the "distributed nature of innovation" is becoming evident. Chennai’s 34% share of SaaS talent and its 5.3X surge in GCC leasing between 2021 and 2025 indicate a specialized dominance that challenges Bengaluru’s "all-rounder" status. Similarly, Hyderabad’s aggressive focus on Biotech and Life Sciences has made it a formidable competitor for R&D-focused capital.
Infrastructural Strain: The 2024 Water Crisis and Its Economic Ripples
The most significant existential threat to Bengaluru’s status is its decaying physical infrastructure. The 2024 water crisis serves as a stark reminder of the city's climate vulnerability. A combination of monsoon failure and over-extraction led to a groundwater depletion of 20%, resulting in a shortfall of 250-600 million liters per day (MLD). With 6,900 of the city's 13,900 borewells running dry, residents and businesses were forced to rely on expensive private tankers, which drill to depths of 1,500 feet.
The economic impact of this resource stress is profound. Data centers, which are the physical backbone of the AI and cloud computing boom, are exceptionally water-intensive. Hydrologists estimate that data centers consume 26 million liters per megawatt annually for cooling. In a hilltop city like Bengaluru, where water must be pumped and treated over long distances, each new hyperscale facility adds a thermal and hydrological load that threatens the drinking water security of its 13 million residents.
Urban Infrastructure and Environmental Challenges Comparison
Factor | Bengaluru Impact | Mumbai Impact | Hyderabad Impact |
Water Security | High Stress (2024 Crisis) | Stable (Coastal/Reservoirs) | Moderate (Planned) |
Commute Efficiency | Low (Severe Congestion) | Moderate (Local Rail) | High (Wider Roads) |
Green Cover Loss | 70% in 50 Years | Managed | Stabilizing |
Paved Surface % | 90% (Low Recharge) | High | Moderate |
Waste Management | Critical Shortfalls | Challenges | Systematic Expansion |
Sources:
The response of the Bengaluru Water Supply and Sewerage Board (BWSSB) has involved implementing IoT sensor-based AI tools to monitor groundwater and filling 63 lakes with treated water. However, experts argue that "day zero" scenarios—similar to Cape Town in 2018—remain a possibility if the city does not halt construction on wetlands and drastically increase its 10% green cover. This environmental risk is a primary driver for firms considering relocation to Pune or more sustainable Tier-2 cities.
Real Estate and the Rise of Global Capability Centers (GCCs)
Despite the infrastructural challenges, the demand for premium Grade-A office space in Bengaluru remains the highest in the country. In 2025, net office leasing across India’s top seven cities hit an all-time high of 55 million square feet, with Bengaluru leading in volume at 14.15 million square feet. However, Bengaluru was the only city to buck the national growth trend, seeing a 5% year-on-year dip in leasing while rents rose by 9% to ₹100 per sq. ft..
The primary driver of this demand is the explosion of Global Capability Centers (GCCs). India now hosts over 1,850 GCCs, employing 2.2 million professionals. These centers are evolving from traditional support offices into strategic innovation hubs. Bengaluru, Hyderabad, and Delhi-NCR account for 85% of this demand.
Office Market Dynamics: Supply, Leasing, and Rental Growth (2025-2026)
City | Net Leasing (Mn sq ft) | Leasing Growth (YoY) | Rental Increase | Vacancy Rate |
Bengaluru | 14.15 | -5% (Dip) | 9% | ~16% |
Pune | 7.8 | 63% (High) | ~6% | Declining |
Delhi-NCR | 11.3 | 16% | ~5% | ~16% |
Chennai | 9.6 | 41% | ~4% | Low |
Hyderabad | 10.1 | -19% (Dip) | ~3% | Moderate |
Sources:
Pune has emerged as the fastest-growing market, recording a massive 63% jump in net leasing. This suggests that "tech-ready" properties are being absorbed more rapidly in cities that offer better cost-per-hire and lower employee attrition. Hyderabad has also capitalized on its better-planned HITEC city and Financial District, offering wide roads and smoother regulatory processes that attract large-format campuses for Google, Microsoft, and Amazon.
Policy and Governance: Competitive Federalism in the Startup Age
The status of Bengaluru is also a reflection of Karnataka’s long-standing policy leadership. The state has topped the national startup rankings for three consecutive years, driven by a combination of innovation-oriented governance and massive startup density. The Karnataka IT-BT Policy 2025-2030 aims to foster 30,000 startups by 2030, with a focus on DeepTech, biotech, and semiconductors. A flagship initiative is the "Beyond Bengaluru" program, which has earmarked nearly ₹960 crore to decentralize the tech economy into innovation clusters like Mysuru and Mangaluru.
However, this dominance is being challenged by other states using targeted incentive strategies.
Telangana: Uses the TS-iPASS single-window clearance system to reduce red tape, positioning Hyderabad as a fresher, more efficient alternative.
Maharashtra: Offers stamp duty rebates and infrastructure subsidies, leveraging Mumbai and Pune’s financial and manufacturing strength.
Tamil Nadu: Leads in patent filing volume and provides export incentives to bolster its status as an automotive and SaaS hub.
State Incentive Highlights and Ease of Doing Business (EoDB) Rankings
State | EoDB Rank 2024 | Incentive Focus | Flagship Scheme |
Gujarat | #1 | Industrial Facilitation | GIFT City |
Maharashtra | #2 | Finance & SaaS | MahaFund (₹500 Cr) |
Karnataka | #3 | R&D & DeepTech | ELEVATE (IDEA2PoC) |
Tamil Nadu | #4 | Manufacturing & EVs | Land Cost Subsidies |
Telangana | #5 | IT & Biotech | TS-iPASS |
Sources:
The emergence of "distributed innovation" is a national goal. The Union Budget 2025 specifically mentioned developing GCC ecosystems for smaller cities to shared wealth outside of metros. Karnataka’s response—offering 50% reimbursement on office rent and ₹50,000 per employee relocation fees for firms moving out of Bengaluru—is a proactive attempt to manage its own congestion while retaining talent within the state borders.
Academic R&D and Intellectual Property: The Seeds of Future Growth
A critical component of a startup capital's longevity is its academic foundation. In 2025, the National Institutional Ranking Framework (NIRF) continued to place the Indian Institute of Science (IISc) Bengaluru and IIT Madras at the top of the research and engineering categories. IISc Bengaluru is particularly notable for its high patent approval rate of 68%, compared to the 43% average for IITs and the significantly lower success rates (under 5%) seen in private universities.
Top Research Institutions and Patent Performance 2025
Institution | NIRF 2025 Rank (Overall) | NIRF Rank (Research) | Patent Success Rate (2020-2023) |
IIT Madras | 1st | 2nd | ~45% |
IISc Bengaluru | 2nd | 1st | 67.8% |
IIT Bombay | 3rd | 4th | ~40% |
IIT Delhi | 4th | 3rd | ~42% |
NIT Trichy | Top 10 | – | 67.1% (Group) |
Sources:
While IIT Madras has topped the overall rankings for seven consecutive years, IISc Bengaluru remains the leader in pure research and innovation metrics. The concentration of high-quality R&D output in Bengaluru, supported by IISc and various central research labs, ensures that the city remains the primary destination for startups requiring "defensible IP" in areas like quantum computing and materials science.
Exit Landscapes: Liquidity, IPOs, and Market Maturity
A definitive startup capital must not only create companies but also provide exits for investors. In 2025, India’s exit environment matured structurally, with IPOs and M&As becoming "predictable and repeatable" rather than episodic. Bengaluru remains the "unicorn capital," hosting 51-53 of India’s 123 unicorns as of December 2025.
The year recorded 42 tech IPOs, a 17% increase over 2024, with major listings including Meesho, Groww, and Pine Labs. A defining feature of the 2025 cohort was the rising share of Offer-for-Sale (OFS) relative to fresh capital, signaling that venture-backed companies are reaching higher EBITDA margins and no longer depend on IPOs solely for growth funding.
Unicorn Density and Valuation Trends by City 2025
Hub | Total Unicorns | Share of National Unicorns | New Unicorns (2025) | Top Sector |
Bengaluru | 51 - 53 | ~42% | 4 - 5 | Fintech & Ecommerce |
Gurugram | 20 | ~16% | 1 - 2 | Consumer & Logistics |
Mumbai | 20 | ~16% | 2 - 3 | Fintech & Media |
Hyderabad | 1 | – | 0 | SaaS / Biotech |
Pune | 2 | – | 0 | Retail / SaaS |
Sources:
The compression of IPO timelines is another sign of maturity. Companies like Physics Wallah, Zepto, and Groww are reaching public markets within five years of raising institutional capital, whereas previous generations took over a decade. Bengaluru continues to strengthen its position as the primary engine for these high-value outcomes, despite the rising growth rates of Mumbai and Delhi.
The Rise of the Rest: Emerging Hubs and the Multipolar Future
While the "Big Three" (Bengaluru, Delhi-NCR, Mumbai) continue to absorb the majority of venture capital, 2025 has seen the crystallization of second-tier hubs.
Hyderabad and Pune: Identified by 45% of investors as the next potential epicenters, these cities are attracting capital due to deeper sector expertise in Biotech and engineering R&D.
Kolkata: Recorded a stunning ecosystem growth rate of 45.7%—the fastest among all Indian cities in 2025—indicating untapped potential in the eastern region.
Chennai: Holds its edge in SaaS and automotive tech, offering 20% lower living costs than Mumbai and a functional international port.
Kochi and Bhubaneswar: Emerging as agritech and renewable energy hubs, supported by proactive state grants and lower operating costs.
Cost of Living and Demographic Comparison (Projected 2026)
City | Single Monthly Expenses (Avg) | 1 BHK Rent (Avg) | COL Index | Attrition Rate |
Mumbai | ₹45,000 | ₹30,000 - ₹60,000 | 25.4 | 24.8% |
Bengaluru | ₹35,000 | ₹18,000 | 24.4 | 25.0% |
Pune | ₹32,750 | ₹16,500 | 22.7 | 14.0% |
Hyderabad | ₹23,500 | ₹11,000 | 21.6 | 12.6% |
Chennai | ₹25,000 | ₹6,000 - ₹40,000 | 20.5 | Moderate |
Sources:
The disparity in cost of living is particularly pronounced for single professionals, where Hyderabad is 28% cheaper than Pune and significantly more affordable than Bengaluru. This cost advantage, combined with modern infrastructure in HITEC city, is forcing global firms to "rethink their dependence" on Bengaluru for volume-heavy engineering and support functions.
Socio-Political Factors and the Risk of Relocation
A new variable in the 2025 startup equation is the influence of socio-political and linguistic factors. Incidents such as the "SBI Kannada row," where a bank manager reportedly refused to speak the regional language, have sparked debates over the "linguistic climate" in Bengaluru. While the city remains a global melting pot, some non-Kannada-speaking staff have expressed concerns over pressure, prompting founders to consider shifts to Pune or Gandhinagar—cities often perceived as "neutral" in terms of linguistic politics.
However, the "Good Riddance" reaction from some local users on social media suggests a growing tension between rapid urban expansion and the preservation of regional culture. For Bengaluru to remain the undisputed capital, it must navigate this cultural friction while addressing the structural failures—potholes, traffic gridlock, and garbage pileups—that have begun to erode its global standing.
Conclusion: Orchestrating a Multipolar Innovation Economy
The analysis of the 2025 landscape suggests that while the term "undisputed" may no longer be technically accurate in the face of Mumbai’s capital surges and Chennai’s SaaS dominance, Bengaluru remains the definitive orchestrator of the Indian startup ecosystem. Its cumulative ecosystem value of over $130 billion, its rank as the #5 global AI hub, and its hosting of nearly half of the nation's unicorns provide a level of depth that cannot be replicated by rapid growth alone.
The future of India’s innovation economy is not a zero-sum game between cities, but a transition toward a "hub-and-spoke" model. Bengaluru will continue to serve as the high-end R&D and DeepTech hub, while Hyderabad, Pune, and Chennai provide the scalability and cost-efficiency required for global competitiveness. For Bengaluru to retain its crown, it must leverage its "tech-first" global perception to attract international capital while urgently addressing the hydrological and infrastructural limits that threaten its sustainability. The city is no longer just a place; it is a statement of India’s technological ambition, and its ability to adapt to the challenges of 2025 will define the trajectory of the nation’s "Startup Decade".

Read More -
1. From Idea to MVP: A Step-by-Step Guide for Solo Founder
🔗 https://findnstart.com/blogs/from-idea-to-mvp-a-step-by-step-guide-for-solo-founder
2. How to Validate Your Startup Idea in 48 Hours for $0
🔗 https://findnstart.com/blogs/how-to-validate-your-startup-idea-in-48-hours-for-0
3. Remote vs. Local: Does Your Co-Founder Need to Live in the Same City?
🔗 https://findnstart.com/blogs/remote-vs-local-does-your-co-founder-need-to-live-in-the-same-city
4. The 2026 Startup Landscape: What Has Fundamentally Changed (and Why Founder Skills Matter More Than Ever)
5. The Most In-Demand Skills for Startup Founders in 2026
🔗 https://findnstart.com/blogs/the-most-in-demand-skills-for-startup-founders-in-2026
6. How to Find a Technical Co-Founder (Without a Six-Figure Salary)
🔗 https://findnstart.com/blogs/how-to-find-a-technical-co-founder-without-a-six-figure-salary
7. 5 Red Flags to Look for When Choosing a Startup Partner
🔗 https://findnstart.com/blogs/5-red-flags-to-look-for-when-choosing-a-startup-partner
8. How to Pitch Your Idea to Potential Co-Founders
🔗 https://findnstart.com/blogs/how-to-pitch-your-idea-to-potential-co-founders
9. How to Build a Portfolio that Attracts High-Growth Startup Founders
🔗 https://findnstart.com/blogs/how-to-build-a-portfolio-that-attracts-high-growth-startup-founders
10. Equity vs. Salary: How to Split Ownership with Your First Teammate
🔗 https://findnstart.com/blogs/equity-vs-salary-how-to-split-ownership-with-your-first-teammate
11. Why Joining an Early-Stage Startup is Better Than a Corporate Job
🔗 https://findnstart.com/blogs/why-joining-an-early-stage-startup-is-better-than-a-corporate-job
12. The Future of EdTech: Why Developers and Educators Need to Team Up Now
🔗 https://findnstart.com/blogs/the-future-of-edtech-why-developers-and-educators-need-to-team-up-now
13. The Architecture of Symbiosis: Analytical Perspectives on the Five Habits of Successful Startup Duos
14. Finding a Co-Founder in the AI Space: What Skills Should You Look For?
🔗 https://findnstart.com/blogs/finding-a-co-founder-in-the-ai-space-what-skills-should-you-look-for
15. Overcoming Analysis Paralysis and the Strategic Path to Execution
🔗 https://findnstart.com/blogs/overcoming-analysis-paralysis-and-the-strategic-path-to-execution
16. From College Project to Company: How to Find Your Student Co-Founder
🔗 https://findnstart.com/blogs/from-college-project-to-company-how-to-find-your-student-co-founder
17. How to Start a Startup While Working a Full-Time Job
🔗 https://findnstart.com/blogs/how-to-start-a-startup-while-working-a-full-time-job
18. How to Build a HealthTech Startup Without a Medical Degree
🔗 https://findnstart.com/blogs/how-to-build-a-healthtech-startup-without-a-medical-degree
19. The Solitary Architect: Executive Isolation in Entrepreneurship
20. The 2026 Guide to Launching a SaaS as a Solo Developer
21. What Sustainable Growth Actually Looks Like
🔗 https://findnstart.com/blogs/what-sustainable-growth-actually-looks-like
22. The Early Warning Signs Your Startup Is in Trouble
🔗 https://findnstart.com/blogs/the-early-warning-signs-your-startup-is-in-trouble
23. How to Grow Without Burning Out
🔗 https://findnstart.com/blogs/how-to-grow-without-burning-out
24. The Truth About “Runway” Most Founders Ignore
🔗 https://findnstart.com/blogs/the-truth-about-runway-most-founders-ignore
25. Revenue Solves More Problems Than Funding
🔗 https://findnstart.com/blogs/revenue-solves-more-problems-than-funding
26. What No One Tells You About Being a Solo Founder
🔗 https://findnstart.com/blogs/what-no-one-tells-you-about-being-a-solo-founder
27. Why Smart People Quit High-Paying Jobs to Build Startups (And Why Most Regret It)
28. Why Most Startup Advice on Twitter Is Dangerous
🔗 https://findnstart.com/blogs/why-most-startup-advice-on-twitter-is-dangerous
29. Decision Fatigue: The Silent Startup Killer
🔗 https://findnstart.com/blogs/decision-fatigue-the-silent-startup-killer
30. Fear vs Logic: How Founders Actually Make Decisions
🔗 https://findnstart.com/blogs/fear-vs-logic-how-founders-actually-make-decisions
31. How Overthinking Destroys Early Momentum
🔗 https://findnstart.com/blogs/how-overthinking-destroys-early-momentum
32. Ideas Don’t Scale. Systems Do.
🔗 https://findnstart.com/blogs/ideas-dont-scale-systems-do
33. The First Hire That Actually Matters
🔗 https://findnstart.com/blogs/the-first-hire-that-actually-matters
34. How the First 100 Users Decide Your Startup’s Fate
🔗 https://findnstart.com/blogs/how-the-first-100-users-decide-your-startups-fate
35. Why Your Startup Doesn’t Need Growth — It Needs Focus
🔗 https://findnstart.com/blogs/why-your-startup-doesnt-need-growthit-needs-focus
36. Why Most Startups Die Quietly
🔗 https://findnstart.com/blogs/why-most-startups-die-quietly
37. Lessons Learned Too Late by First-Time Founders
🔗 https://findnstart.com/blogs/lessons-learned-too-late-by-first-time-founders
38. The Myth of the “Overnight Success” Startup
🔗 https://findnstart.com/blogs/the-myth-of-the-overnight-success-startup
Want to calculate the equity for your cofounder?
Nail your cap table before you sign. Whether you're splitting equity with a co-founder or planning your next funding round, our Equity Calculator gives you precision in seconds
Equity calculator →