Revenue First, Valuation Later — Is the Shift Permanent?
June 28, 2026 by Harshit Gupta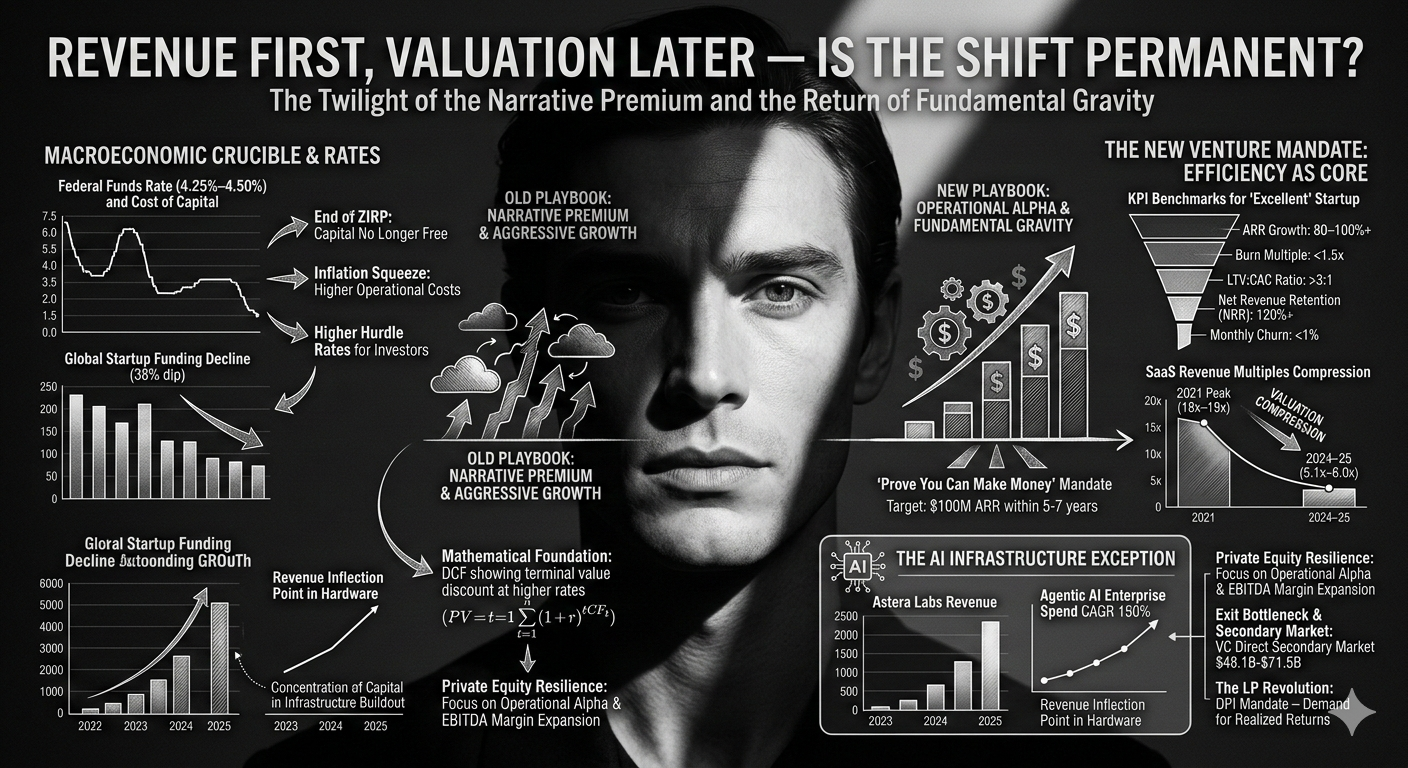
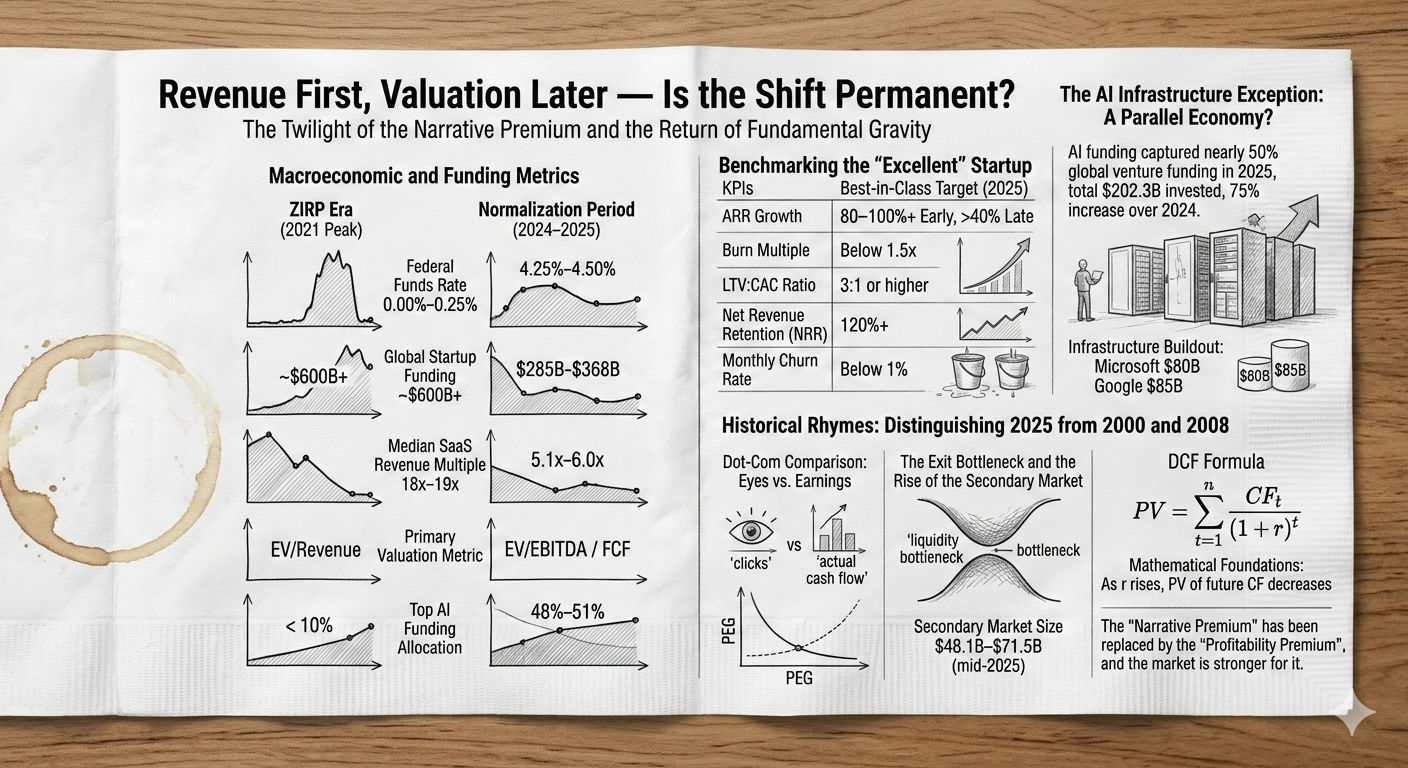
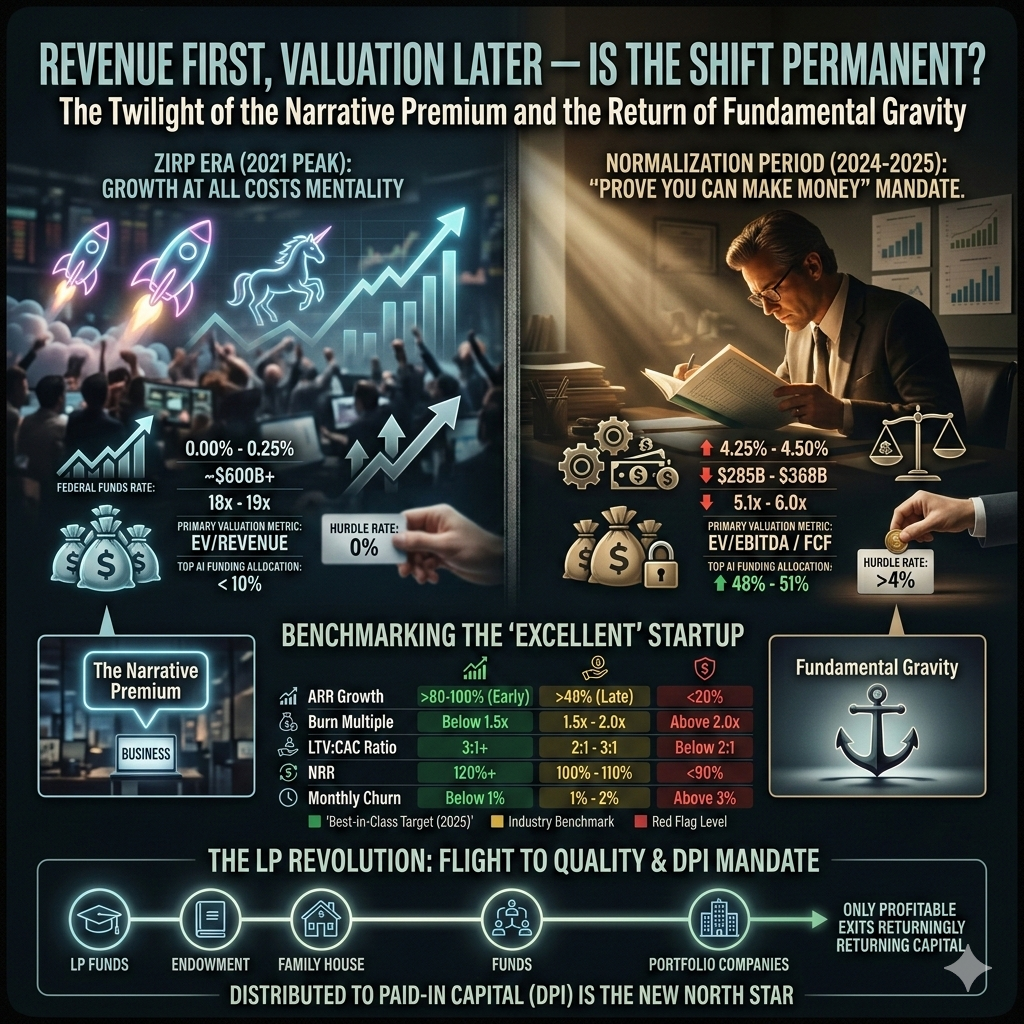
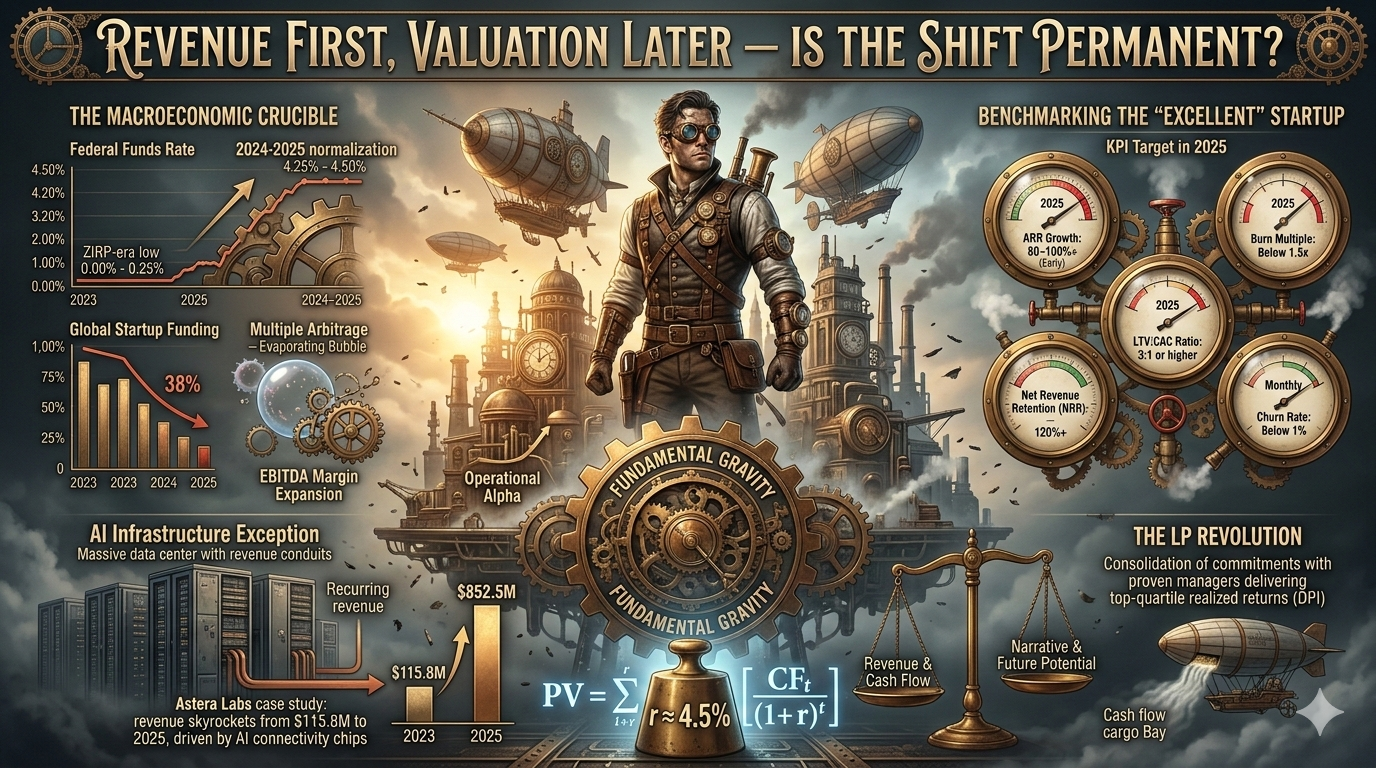
The Twilight of the Narrative Premium and the Return of Fundamental Gravity
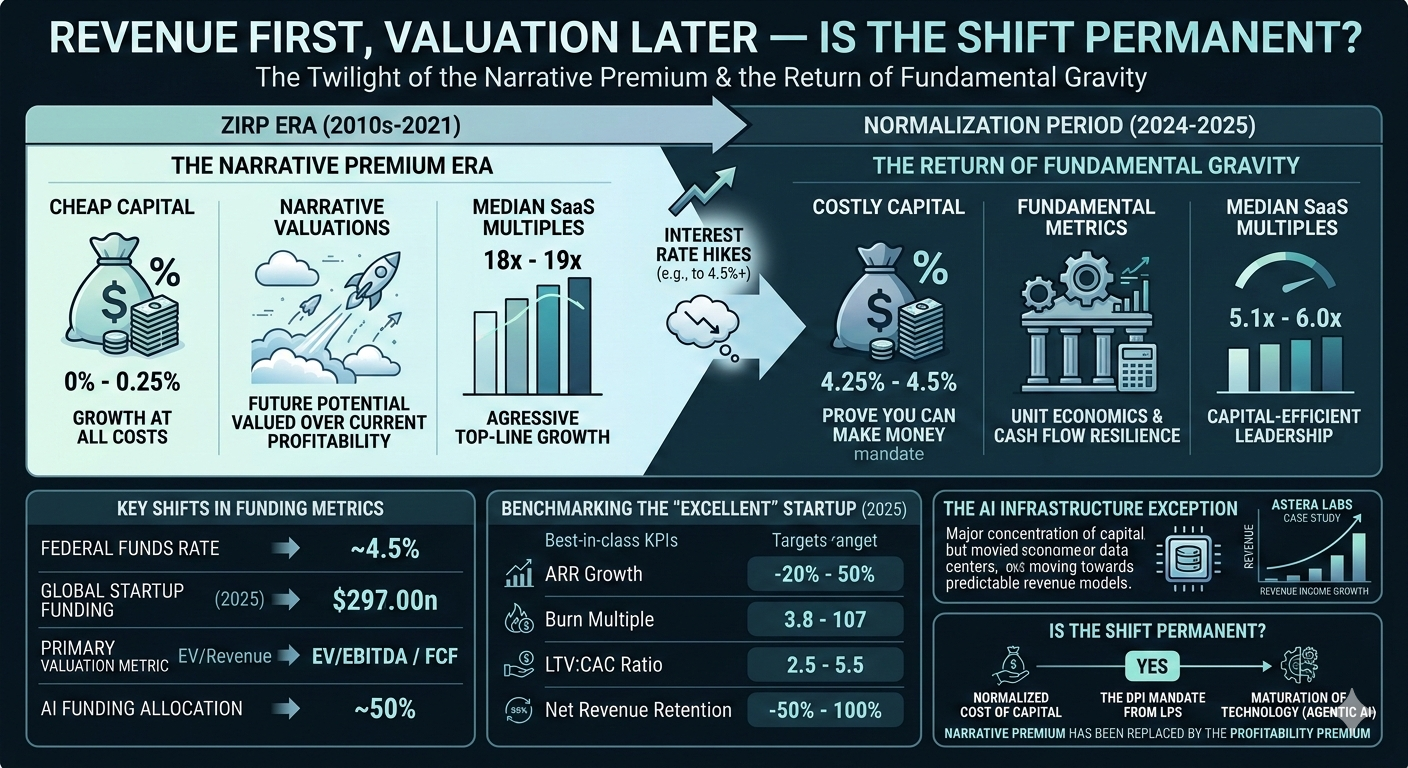
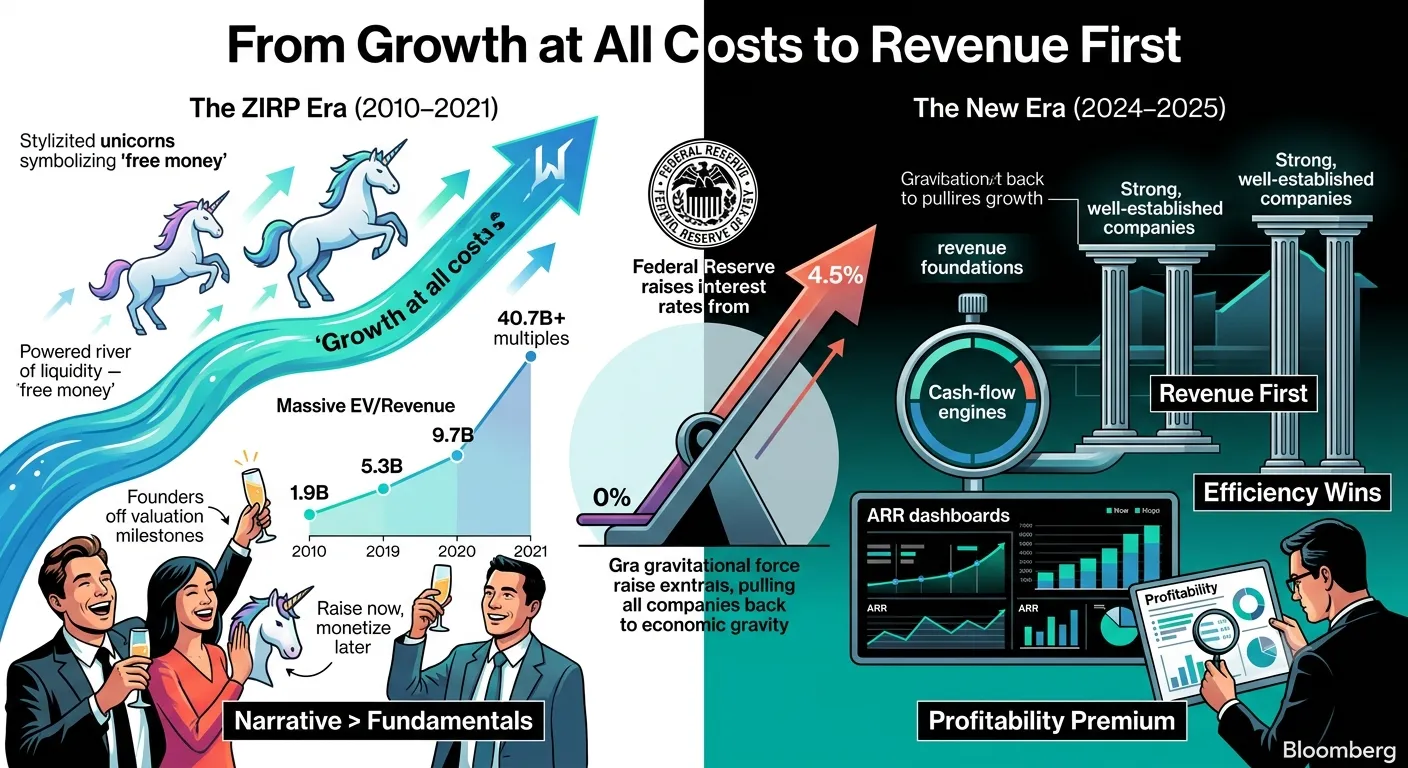
The global investment landscape in 2025 stands as a testament to the re-imposition of economic gravity following a decade of distorted capital costs. The transition from the Zero Interest Rate Policy (ZIRP) era to a sustained environment of higher interest rates has fundamentally altered the relationship between revenue generation and company valuation. For much of the period between 2010 and 2021, venture capital and private equity markets operated under a "narrative premium," where future potential and aggressive top-line growth were valued more highly than current profitability or unit economic stability. However, as the Federal Reserve maintained interest rates between 4.25% and 4.5% through early 2025, the opportunity cost of capital sitting on the sidelines became enormous, forcing a recalibration toward assets that can demonstrate tangible cash flow resilience.
This shift is not merely a cyclical correction but a structural realignment of the innovation economy. The "growth at all costs" mentality, which reached its zenith in 2021, has been discarded in favor of a "prove you can make money" mandate. Today, venture-scale potential is no longer defined simply by reaching unicorn status through successive rounds of dilutive funding; it is measured by the ability to achieve at least $100 million in Annual Recurring Revenue (ARR) within five to seven years while maintaining a sustainable burn multiple. This transformation is reshaping the very DNA of leadership, necessitating a new class of "capital-efficient leaders" who can navigate the complex balance between aggressive growth targets and disciplined financial performance.
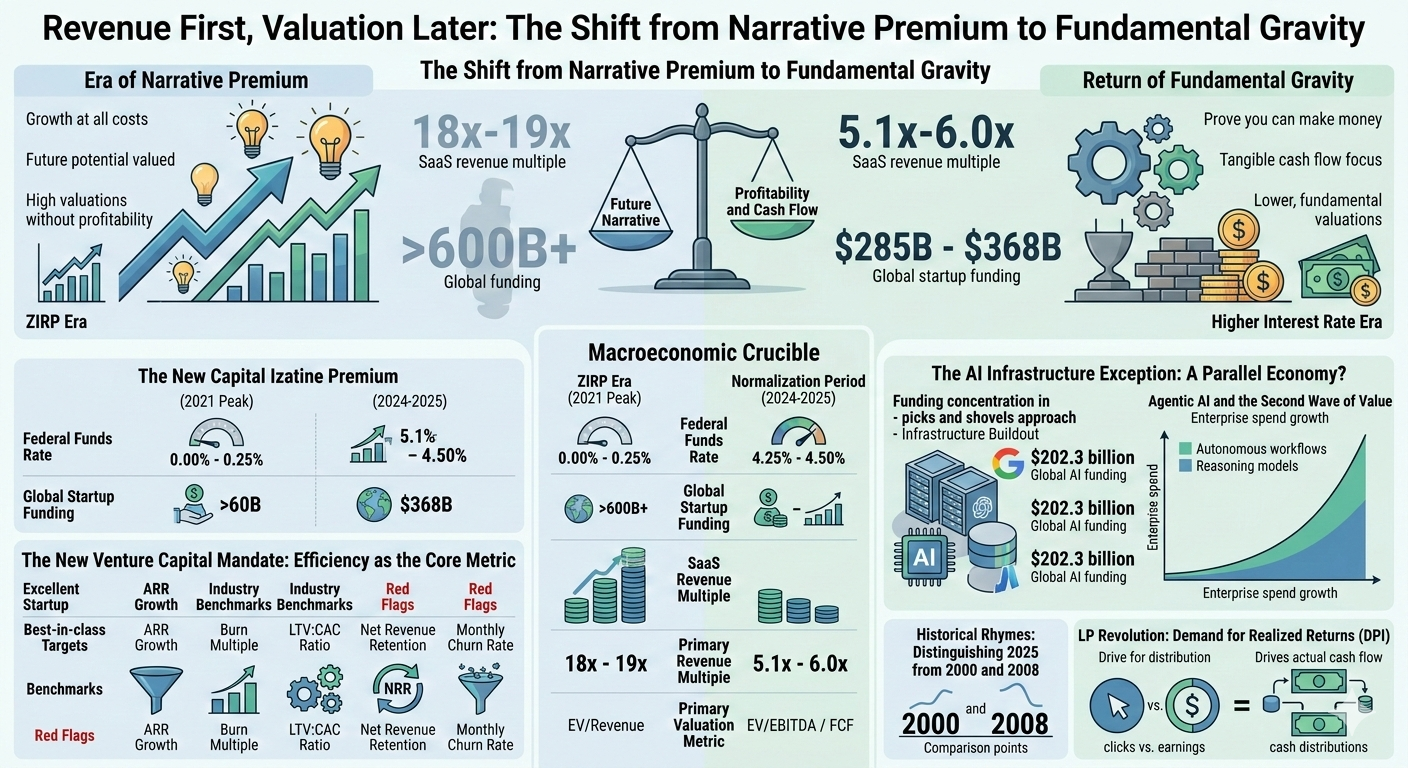
Macroeconomic and Funding Metrics | ZIRP Era (2021 Peak) | Normalization Period (2024-2025) | Market Implications |
Federal Funds Rate | 0.00% - 0.25% | 4.25% - 4.50% | Capital is no longer free; discount rates have risen |
Global Startup Funding | ~$600B+ | $285B - $368B | 38% decline in 2023; selective recovery in 2024-25 |
Median SaaS Revenue Multiple | 18x - 19x | 5.1x - 6.0x | Massive compression in public/private comps |
Primary Valuation Metric | EV/Revenue | EV/EBITDA / FCF | Shift to realized efficiency and cash flow |
Top AI Funding Allocation | < 10% | 48% - 51% | Concentration of capital in infrastructure |
The Macroeconomic Crucible: Rates, Inflation, and the Cost of Capital
The causal relationship between central bank policy and investment behavior has become the defining feature of the 2025 market. Higher interest rates have dual effects on the startup ecosystem: they make borrowing more expensive for growth-stage companies and simultaneously increase the "hurdle rate" for investors, who can now find attractive returns in safer assets like Treasuries. Data indicates that a 1% increase in interest rates historically leads to a 3.2% drop in venture capital fundraising, a trend that became starkly visible as global funding fell to its lowest levels in five years by 2023.
Inflation further complicates this landscape by increasing operational costs—salaries, software, rent, and marketing—all while discretionary consumer spending often declines. For startups, particularly those in the B2C segment, this "inflationary squeeze" necessitates an immediate shift toward unit economic viability. Investors are now favoring businesses with sustainable revenue models that can weather these headwinds without requiring constant infusions of external capital.
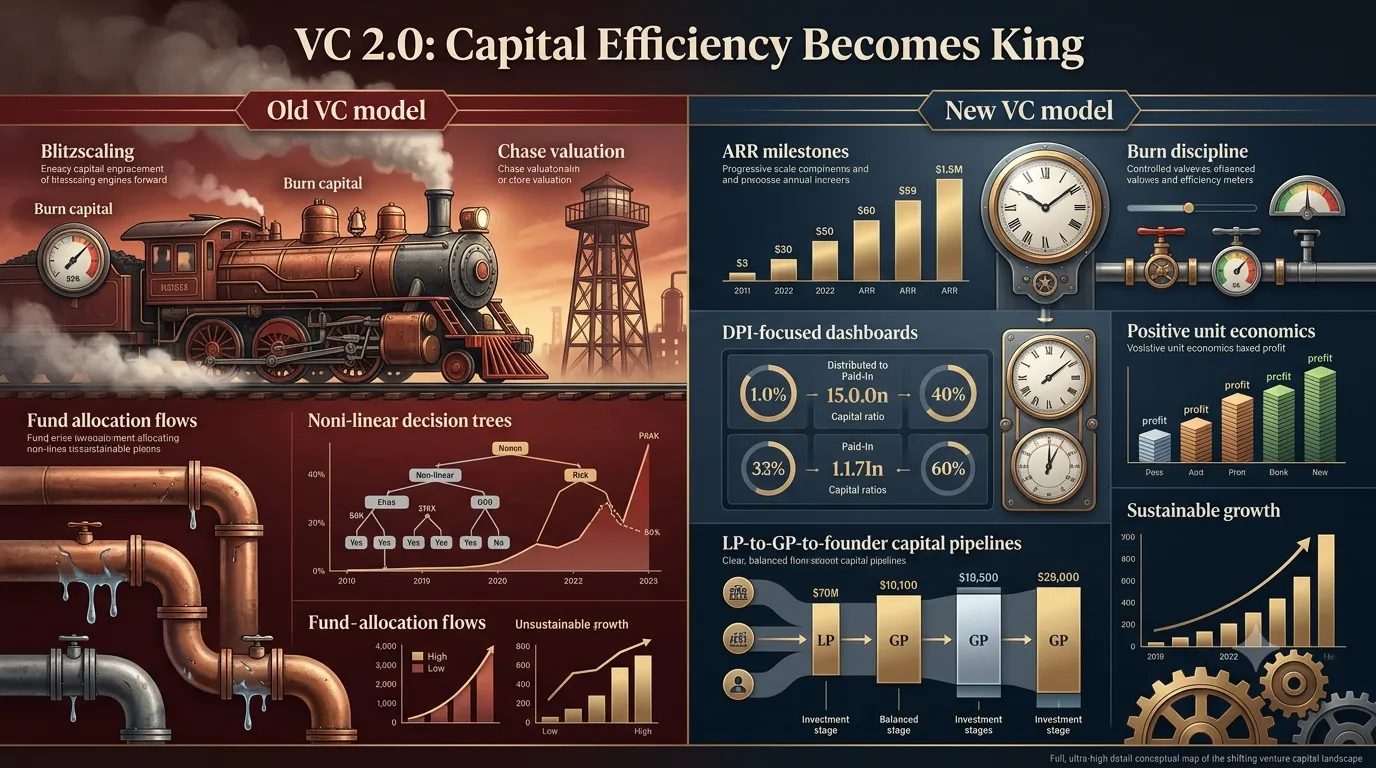
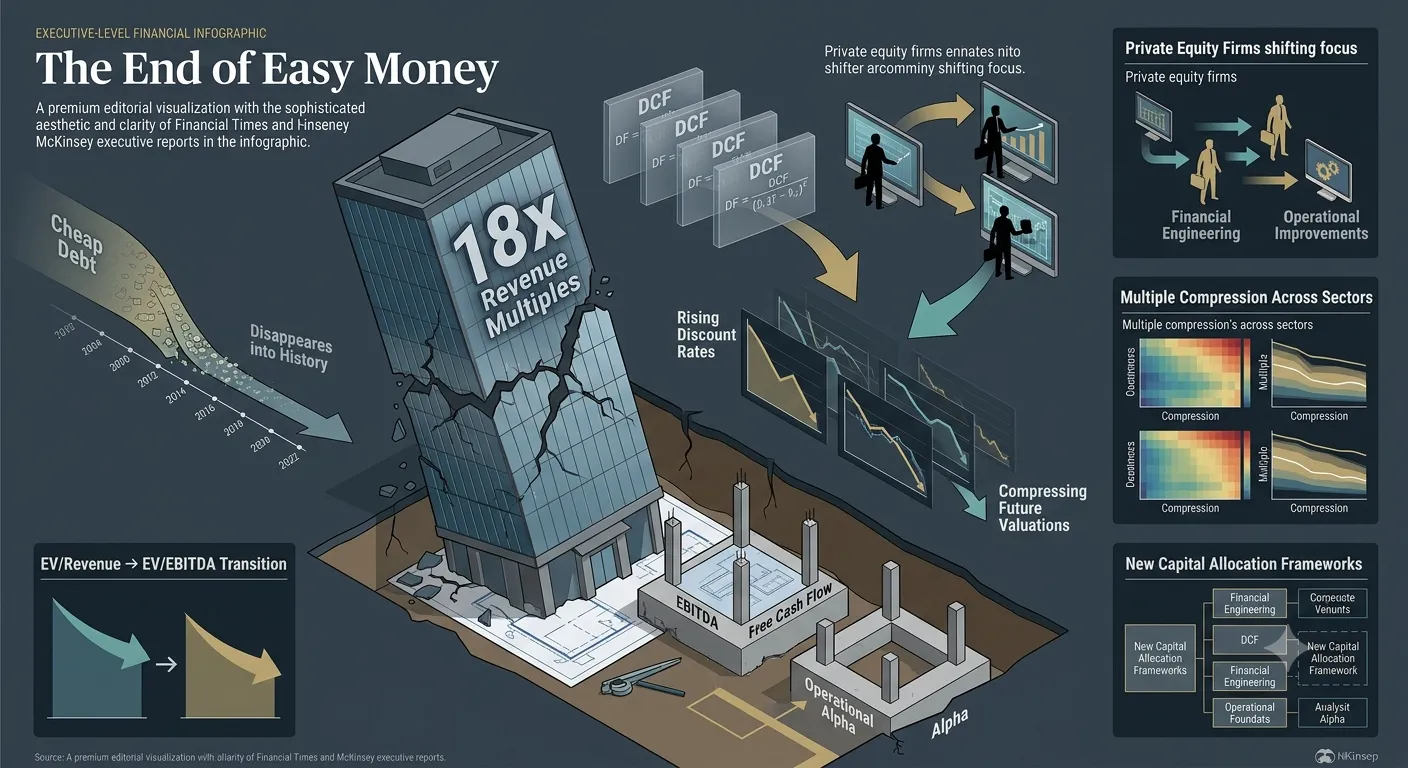
The End of Multiple Arbitrage
In the private equity sector, the transition has disrupted the traditional value creation playbook. Historically, PE firms relied heavily on financial leverage—cheap debt—and "multiple arbitrage" to drive Internal Rates of Return (IRR). In an era of high interest rates, the ability to "buy low and sell high" on the back of expanding market multiples has evaporated. Instead, the industry has pivoted toward "Operational Alpha," where returns are generated through systematic EBITDA margin expansion and technological transformation at scale. This shift requires a greater sophistication in portfolio monitoring and a "probabilistic and adaptive" approach to decision-making, utilizing data to map IRR dispersion against volatile macro variables like inflation and trade policy.
The New Venture Capital Mandate: Efficiency as the Core Metric
The venture capital industry is undergoing a significant transformation, with a higher bar set at each funding stage. Even at the seed stage, investors are demanding more proof-of-concept and a clearer path to profitability than in prior years. Pre-money valuations at the seed stage were down 20-30% by 2025 compared to their 2023 peaks, reflecting a more realistic alignment between investor and founder expectations.
Benchmarking the "Excellent" Startup
To navigate this selective environment, investors have coalesced around a set of rigorous growth benchmarks. These metrics serve as the new "North Star" for companies seeking to attract capital in 2025. The focus has moved from sheer growth volume to the efficiency of that growth, encapsulated in the "Rule of 40" and the "Burn Multiple".
Key Performance Indicator (KPI) | Best-in-Class Target (2025) | Industry Benchmark | Red Flag Level |
Annual Recurring Revenue (ARR) Growth | 80–100%+ (Early-stage) | >40% (Late-stage) | Stagnant or <20% growth |
Burn Multiple (Net Burn / New ARR) | Below 1.5x | 1.5x – 2.0x | Above 2.0x |
LTV:CAC Ratio | 3:1 or higher | 2:1 to 3:1 | Below 2:1 |
Net Revenue Retention (NRR) | 120%+ | 100% - 110% | <90% (Leaky bucket) |
Monthly Churn Rate | Below 1% | 1% – 2% | Above 3% |
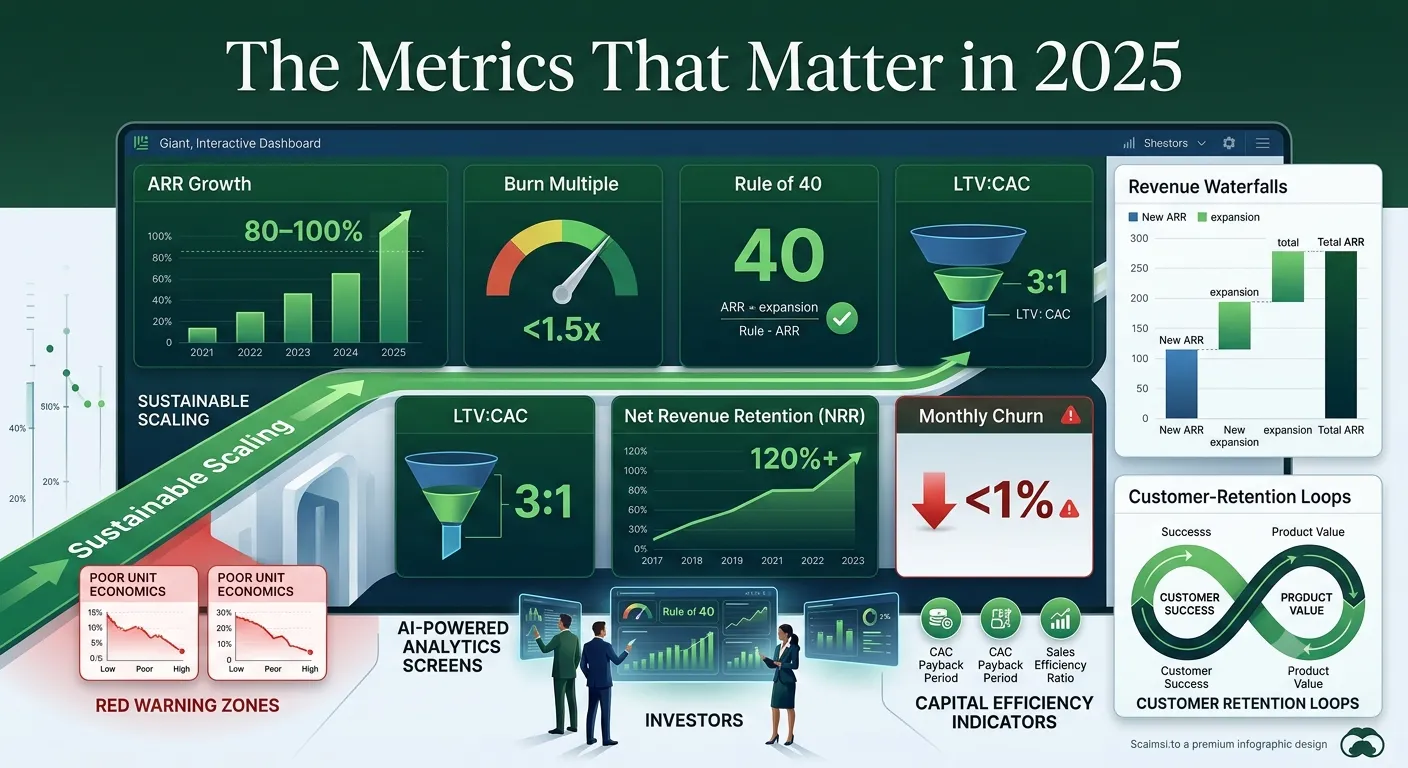
The emphasis on Net Revenue Retention (NRR) is particularly instructive. Investors view NRR as the single best indicator of value delivery; if existing customers are sticking around and spending more, the company is growing in a capital-efficient manner that does not require constant, expensive customer acquisition. Conversely, companies with high churn are viewed as having "leaky buckets," regardless of how much new revenue they are able to attract through aggressive marketing spend.
The AI Infrastructure Exception: A Parallel Economy?
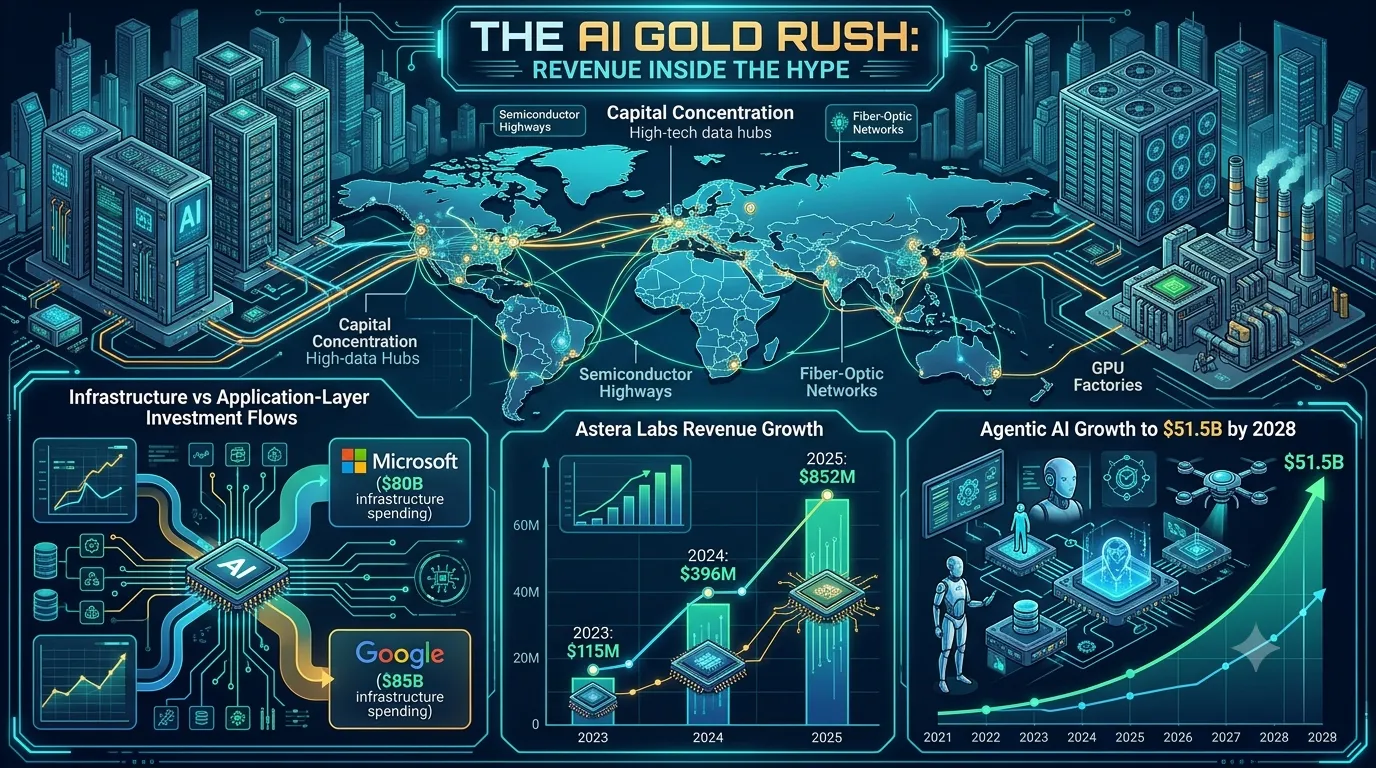
While the broader market grapples with profitability, the Artificial Intelligence (AI) sector has emerged as a formidable exception to the "revenue-first" rule, though even here, the focus is shifting toward foundational infrastructure with predictable revenue models. AI funding captured nearly 50% of all global venture funding in 2025, with a total of $202.3 billion invested—a 75% increase over 2024.
This massive concentration of capital is directed primarily at the "Infrastructure Buildout," characterized by unprecedented capital requirements. Leading technology companies like Microsoft and Google have committed upwards of $80 billion and $85 billion respectively in 2025 alone to build data center capacity. This "picks and shovels" approach is favored by private equity and large asset managers because it offers stable, long-term projected demand growth and recurring revenues, making it a "Steady Eddie" investment despite the volatility of the application layer.
The Revenue Inflection Point in AI Hardware
The exception to the AI hype is the emergence of companies that are already translating infrastructure demand into massive top-line expansion and profitability. Astera Labs serves as a prime case study for this transition.
Fiscal Year | Astera Labs Revenue | Net Income / (Loss) | Key Driver |
2023 | $115.8 Million | (Net Loss) | Initial cloud connectivity buildout |
2024 | $396.3 Million | (Net Loss) | Scaling AI hardware family |
2025 | $852.5 Million | $219.1 Million | Dominance in AI connectivity chips |
However, this growth comes with concentrated risk; for Astera Labs, a single end customer generated over 70% of revenue in 2025. This highlights a broader trend in the AI economy: while the infrastructure providers are beginning to show "revenue first," the concentration of that revenue among a few hyperscale buyers creates a fragile equilibrium.
Agentic AI and the Second Wave of Value
As the infrastructure layer matures, the market is looking toward "Agentic AI"—reasoning models and autonomous workflows—as the next major growth opportunity. Enterprise spend on agentic AI is projected to rise from less than $1 billion in 2024 to $51.5 billion by 2028, a staggering 150% Compound Annual Growth Rate (CAGR). The implication for startups is clear: "AI wrappers" are no longer sufficient to command premium valuations; founders must now demonstrate how their AI integration drives structural adoption and measurable P&L impact for enterprises.
Historical Rhymes: Distinguishing 2025 from 2000 and 2008
To determine if the current shift toward revenue is permanent, one must compare it to previous market cycles. The dot-com bubble of 2000 and the global financial crisis (GFC) of 2008 both involved major resets in valuation, but 2025 exhibits fundamental differences in market stability.
The Dot-Com Comparison: Eyes vs. Earnings
The 2000 bubble burst because valuations soared while too few internet companies had viable paths to profitability. Speculative metrics like "clicks" and "eyeballs" were used to mask a lack of fundamental revenue. In contrast, the 2025 market is described as "more measured." Today's leading technology firms are significantly more profitable and have more robust top-line revenue growth than their counterparts in 2000.
Valuation Multiples: Relative valuations based on earnings growth (such as the PEG ratio) in 2025 stand well below the extremes of 2000.
Concentration of Returns: In the two years leading up to the March 2000 peak, technology stocks accounted for 74% of market gains; in 2025, they represent a smaller share at 56%.
Business Maturity: Concepts that were speculative in 2000—such as e-commerce, cloud computing, and social media—are now fully embedded in daily life, providing a stable foundation for the current AI expansion.
The Private Equity Resilience Factor
Data from the GFC indicates that private equity-backed companies tended to recover faster and capture more market share than their non-PE-backed competitors. Recession years often produce the strongest performing "vintages" for private equity; the 2001 and 2008-2009 periods yielded investment multiples of 2.11x and 1.51x respectively. This historical resilience suggests that the current "profitability pivot" may be a mechanism for the industry to generate outsized returns during a period of macroeconomic uncertainty.
The Exit Bottleneck and the Rise of the Secondary Market
A critical challenge to the "revenue-first" paradigm is the stagnation of traditional exit markets. IPO and M&A activity, while showing signs of life in late 2024 and early 2025, remain sluggish compared to the ZIRP-era highs. Regulatory hurdles, such as increased FTC scrutiny and the EU's AI regulations, have created a "bid/ask spread" that keeps many strategic acquisitions from closing.
As a result, more companies valued at $500 million or more are sitting in VC portfolios than ever before, leading to an aging asset problem for Limited Partners (LPs). To address this "liquidity bottleneck," the secondary market has emerged as a vital structural pillar of the venture ecosystem.
Secondary Market Size: The U.S. VC direct secondary market is estimated at $48.1 billion to $71.5 billion as of mid-2025.
Concentrated Quality: Trading volume is highly concentrated; in early 2025, just 20 startups accounted for 83.2% of all secondary trading volume.
Tender Offers: Companies like Plaid have utilized tender offers to provide liquidity to employees and early investors without the volatility of an IPO.
This "secondary release valve" allows for price discovery based on actual financial performance rather than speculative future gains, further reinforcing the shift toward revenue-based valuation.
Sectoral Transformations: SaaS, Fintech, and the Deep Tech Renaissance
The mandate for revenue-first valuation has permeated every sector of the startup economy, though its implementation varies by business model.
SaaS: From Growth at All Costs to the Rule of 40
The SaaS sector has been the most visible beneficiary and victim of valuation shifts. During the peak of 2021, the median SaaS revenue multiple held between 18.0x and 19.0x, with Asana setting a record at 89.0x revenue. By late 2025, the median had collapsed to 5.1x.
SaaS growth rates are also facing long-term headwinds. The median annual growth rate for public SaaS companies slipped from 17% in 2023 to 12.2% by late 2025. Consequently, investors now reward "operational efficiency" and "meaningful AI integration" rather than speculative growth.
Fintech: The Turnaround in Credit Discipline
Fintech companies are similarly prioritizing profitability and regulatory stability. Affirm's performance in fiscal year 2025 illustrates this pivot: revenue grew 38.8% to $3.22 billion, pushing the company into a net profit of $52.19 million. This turnaround was driven by a focus on "lower-risk products" and "AI-powered underwriting," which reduced the provision for credit losses and improved gross profit margins to 46%. In fintech, the "revenue first" strategy is inseparable from credit discipline.
Deep Tech: Tackling Complex Challenges
While software has slowed, "Deep Tech" sectors like manufacturing automation, space commercialization, and climate technology have gained favor. Investors are increasingly willing to tackle longer development cycles and higher capital requirements in exchange for "hardware cost reductions" and "supply chain resilience". This sectoral evolution reflects a maturing ecosystem where venture capital is moving beyond "pure software plays" to embrace a broader range of technological innovation.
The LP Revolution: Demand for Realized Returns (DPI)
The ultimate driver of the "Revenue First" shift is the changing expectation of Limited Partners (LPs). Institutional investors—endowments, pension funds, and family offices—are moving away from "paper gains" that may never materialize. They are now focusing on actual cash returns, specifically Distributed to Paid-In Capital (DPI).
LPs are consolidating their commitments with "proven managers" who have consistently delivered top-quartile returns. This "flight to quality" has created a gap between elite funds and average ones, with many LPs restructuring their portfolios toward alternative investments that offer "actual cash returns". This pressure from LPs forces VC and PE firms to demand profitability from their portfolio companies, as profitable exits are the only reliable way to generate the required liquidity.
Mathematical Foundations of the Valuation Shift
The transition can be modeled using a standard Discounted Cash Flow (DCF) framework. As interest rates (r) rise, the present value (PV) of future cash flows (CF) decreases, particularly for companies whose significant cash flows are expected many years in the future (n).
PV=t=1∑n(1+r)tCFt
Under ZIRP (r≈0), the denominator remains small even for large values of n, justifying high valuations for pre-revenue companies. In 2025, with r≈4.5%, the terminal value of these companies is heavily discounted, shifting the valuation weight to the CF generated in years 1 through 5. This mathematical reality makes "Revenue First" an inescapable logic for any rational investor.
Conclusion: Is the Shift Permanent?
The evidence gathered from the 2024-2025 market cycle suggests that the shift toward "Revenue First, Valuation Later" is a permanent structural change for several key reasons. First, the cost of capital has normalized; even with potential rate cuts, the era of "near-zero" interest rates is widely considered an historical anomaly. Second, the "DPI mandate" from LPs has fundamentally changed how venture and private equity firms are evaluated and compensated, ensuring that realized returns will remain a priority. Finally, the maturation of technology—from the speculative "eyeballs" of 2000 to the "agentic automation" of 2025—means that the infrastructure is now in place for companies to build sustainable, profitable businesses from day one.
While AI currently represents a concentrated bubble of high-valuation infrastructure spend, even this sector is being pulled toward the gravity of revenue, as seen in the hardware layer. For founders, the new rules are clear: growth must be "efficient," teams must be "capital-efficient," and the "path to $100M ARR" must be visible. In this new era, valuation is no longer a vanity metric used to fuel more dilution; it is a lagging indicator of a business’s ability to generate sustainable, defensible value in a high-interest-rate world. The "Narrative Premium" has been replaced by the "Profitability Premium," and the market is stronger for it.
Want to calculate the equity for your cofounder?
Nail your cap table before you sign. Whether you're splitting equity with a co-founder or planning your next funding round, our Equity Calculator gives you precision in seconds
Equity calculator →