Climate Tech That Actually Makes Money
February 26, 2026 by Harshit GuptaThe global climate technology landscape underwent a profound structural transformation by the midpoint of the 2020s, moving decisively from a decade of speculative exploration to an era defined by rigorous commercial logic and operational execution. The year 2025 represents a definitive inflection point where the market began to reward execution over experimentation and tangible evidence over broad ambition. As the sector stabilized into what analysts describe as the "new normal," the primary focus for institutional investors, sovereign wealth funds, and corporate strategics shifted toward identifying and scaling technologies with proven unit economics, resilient supply chains, and undeniable paths to profitability.
Total global investment in the energy transition reached a staggering record of $2.3 trillion in 2025, an 8% increase from the prior year. This growth occurred despite significant geopolitical fragmentation and shifting policy priorities in major markets like the United States and China. The resilience of the sector is increasingly anchored in established technologies—such as utility-scale solar, battery energy storage systems (BESS), and electrified transport—which have transitioned from subsidized niche plays to mainstream assets with well-established business models. However, the most compelling narrative of 2025 is the emergence of a high-margin, software-defined layer of climate tech that leverages artificial intelligence to optimize physical infrastructure, effectively decoupling decarbonization from pure capital-intensive hardware plays.
The Macro-Economic Foundations of Climate Tech Profitability
The commercial maturation of climate tech is best understood through the widening gap between clean energy supply and fossil fuel investment. In 2025, clean energy supply investment outpaced fossil fuels for the second consecutive year, with the disparity reaching $102 billion. While fossil fuel supply investment saw its first decline since 2020, dropping by $9 billion, the appetite for renewables, energy storage, and power grids remained robust, even as the growth rate slowed from the double-digit surges seen between 2021 and 2023.
The following table delineates the distribution of global energy transition investment across the primary drivers of the 2025 market:
Investment Sector | 2025 Investment (USD Billion) | YoY Growth (%) | Primary Market Driver |
Electrified Transport | $893 | +18.0% | Consumer uptake and fleet mandates |
Renewable Energy | $690 | -5.2% | Regulatory shifts in China/U.S. |
Power Grids | $483 | +23.8% | AI data center demand and resilience |
Clean Energy Supply Chain | $127 | -2.3% | Battery manufacturing and metals |
Climate-Tech Equity | $77.3 | +52.5% | Public market recovery and M&A |
Energy Transition Debt | $1,200 | +17.0% | Corporate and project finance |
The decline in renewable energy funding—specifically a 9.5% year-on-year drop—is primarily attributed to changing power market regulations in China and the sunsetting of certain federal tax credits in the United States under the One Big Beautiful Bill Act (OBBBA). Despite these headwinds, the "big three" verticals—Transport, Energy, and Food & Land Use—continue to command nearly 80% of total funding, with Energy overtaking Transport as the most-funded vertical for the second consecutive year.
The Role of High-Interest Rates and Capital Selectivity
The 2024-2025 period forced a "normalization" of climate tech valuations. Elevated borrowing costs and uncertain economic conditions initially cooled the venture capital market, which saw three consecutive years of contraction through late 2024. However, equity financing stabilized by 2025 as investors pivoted toward de-risked, mature technologies with clear paths to market.
Venture and growth investment reached $40.5 billion in 2025, an 8% uptick, yet the number of deals fell to a four-year low of 1,545. This "feast-or-famine" dynamic indicates that capital is concentrating in category leaders—often referred to as "soonicorns"—that have cleared engineering risks and can demonstrate credible cost curves. Series C has emerged as the "new valley of death," with deal counts hitting an all-time low and investment in that stage declining by 32%. Conversely, growth-stage investment jumped 78% in 2025, signaling that the market is now a performance-driven environment where operational resilience is prized over technical ambition.
Solar PV and the Utility-Scale Profitability Machine
The solar industry in 2025 serves as the primary example of climate tech that "actually makes money." Solar PV accounted for half of all clean technology investments and two-thirds of newly installed megawatts globally. The sector's profitability is driven by massive scale, declining component prices, and a disciplined approach to contracting.
NextEra Energy: The Benchmark for Utility Profitability
NextEra Energy (NEE) continues to define the financial standard for renewable energy utilities. The company's performance in 2025 highlights the stability of the "renewables-as-a-service" utility model. NEE reported an annual EBITDA of $15.22 billion in 2025, a nearly 15% increase over the previous year. Its adjusted earnings per share (EPS) grew by approximately 8.2% in 2024, consistently hitting the top end of expectations.
The quarterly EBITDA trajectory for NextEra Energy illustrates the sector's resilience:
Quarter Ending | EBITDA (USD Billion) | YoY % Change |
2025-09-30 | $4.720 | +3.15% |
2025-06-30 | $3.768 | +19.96% |
2025-03-31 | $3.432 | +14.36% |
2024-12-31 | $2.522 | -41.90% |
NextEra's strategy relies on a dual-engine model: Florida Power & Light (FPL), a regulated utility that provides a steady cash flow base, and NextEra Energy Resources, which operates as the world's largest generator of renewable energy from wind and solar. This diversification allows the company to maintain a 10% annual dividend growth rate through at least 2026, regardless of federal policy fluctuations.
First Solar: Vertical Integration and the 45X Advantage
First Solar (FSLR) provides the definitive case study for profitable climate hardware. In 2025, the company achieved record net sales of $5.2 billion, a 24% increase from 2024, driven by a surge in third-party module volume. First Solar's profitability is deeply linked to its U.S.-based manufacturing footprint, which allows it to monetize the Section 45X Advanced Manufacturing Production Credit.
In 2025 alone, First Solar recognized $1.6 billion in 45X tax credits. However, the company's "true" profitability—excluding these credits—is also strengthening. While its 2025 gross margin was 41%, excluding the 45X credit, the margin was approximately 7%. Management aims to return to high-teens or 20% non-credit margins by 2027 by addressing underutilization costs ($135 million) and tariff-related warehousing expenses ($200 million).
The financial health of First Solar at year-end 2025 is summarized below:
Metric | 2025 Reported Value | 2026 Guidance |
Net Sales | $5.2 Billion | $4.9 - $5.2 Billion |
Net Income per Diluted Share | $14.21 | N/A |
Adjusted EBITDA | $2.36 Billion | $2.6 - $2.8 Billion |
Net Cash Balance | $2.4 Billion | $1.7 - $2.3 Billion |
Contracted Backlog | 50.1 GW ($15 Billion) | N/A |
First Solar's success is rooted in its "CuRe" (copper replacement) thin-film technology, which reduces degradation over time. While the transition to this technology resulted in a 3% lower gross margin in 2025, the long-term benefit is a superior product that commands an average selling price (ASP) of $0.364 per watt in the U.S. utility-scale market—significantly higher than global averages.
Energy Storage: The Integration of Hardware and Physical AI
Energy storage transitioned from an "emerging" sector to a "mainstream" one in 2025, with battery energy storage systems (BESS) surpassing pumped hydro in new installed capacity. The sector's commercial logic has shifted from the mere provision of hardware to the optimization of energy arbitrage through "Physical AI"—the use of autonomous agents to bid capacity into wholesale markets.
Tesla Energy: From EV Ancillary to Margin Leader
Tesla’s energy segment emerged as its primary margin driver in 2025, even as its automotive revenue faced downward pressure. The company reported a record 46.7 GWh of energy storage deployments in 2025, earning nearly $12.8 billion in annual revenue from this segment alone.
Tesla Energy Segment | 2024 Performance | 2025 Performance |
Storage Deployments | 14.7 GWh | 46.7 GWh |
Segment Revenue | $7.6 Billion (Est) | $12.8 Billion |
Revenue Growth % | +67% | +26.6% |
Segment Gross Margin | ~20% | 29.8% |
Tesla's edge lies in its vertical integration of the Powerwall and Megapack with its "Autobidder" platform, which automates energy trading for battery operators. In South Australia, the Hornsdale Power Reserve—a 150 MW Tesla system—reduced grid costs by $40 million annually through these automated optimizations. However, management warned of margin compression in 2026 due to the entry of low-cost Chinese competitors like Sungrow, which also maintains an AAA bankability rating.
Fluence Energy and the Software Advantage
Fluence Energy (FLNC) achieved net profitability in Q3 2025, reporting $1.04 billion in revenue and $17.9 million in net income. As the largest pure-play energy storage company, Fluence has differentiated itself through its "Mosaic" intelligent bidding and "Nispera" asset performance management software. This AI-powered layer maximizes the return on investment (ROI) of BESS assets, allowing for annual profitability gains of nearly $25 per kilowatt-hour compared to non-optimized systems.
The deployment of modular, high-density designs like "Smartstack" has allowed Fluence to increase energy density by 30%, further improving project economics. For global utilities, the ability to deploy these systems as "turnkey" solutions—where the provider manages everything from balance-of-plant equipment to the bidding software—is the key to scaling without the massive overhead associated with bespoke engineering.
Digital Decarbonization: The High-Margin SaaS Frontier
If hardware is the muscle of the energy transition, software is the nervous system. In 2025, climate-focused Software-as-a-Service (SaaS) and AI solutions emerged as the highest-margin segment of the market, typically boasting 50-80% margins compared to the 15-20% seen in hardware manufacturing.
Carbon Accounting and the Regulatory Mandate
The transition of climate data into material financial data has catalyzed a surge in carbon accounting SaaS. Regulators worldwide—and increasingly large corporations like Apple and Amazon—now require suppliers to disclose Scope 1, 2, and 3 emissions as a condition of market participation. This has created an essential market for "picks and shovels" companies that provide auditable, real-time environmental footprints.
Platform | Key Value Proposition | Technology Edge |
Watershed | Scope 3 transparency | Supplier energy data integration |
Plan A | Decarbonization ROI | AI-driven data mapping & anomaly detection |
Normative | EU policy compliance | AI-driven Scope 3 modeling |
Salesforce Net Zero Cloud | Enterprise-wide analytics | Science-based targets & scenario planning |
The commercial brilliance of these platforms lies in their "stickiness." Once a multinational corporation integrates Plan A or Salesforce Net Zero Cloud into its procurement workflow, the carbon footprint of a specific supplier becomes a daily KPI. This shift from a once-a-year sustainability report to an actionable metric transforms carbon management from a cost center into an efficiency-driving strategic lever.
AI and Data Center Load Growth
The build-out of AI infrastructure is a double-edged sword for climate tech. While AI data centers consume vast amounts of energy—with 23 GW currently live in the U.S. and another 48 GW committed—they are also the primary customers for clean firm power. Hyperscalers are increasingly bypass-ing traditional utilities to sign record-setting corporate PPAs for zero-carbon baseload electricity, particularly from nuclear and geothermal sources.
AI-centered climate ventures raised $6 billion in the first three quarters of 2024, surpassing the total for all of 2023. These companies focus on "Agentic AI"—autonomous agents that can manage grid fluctuations, discover new battery materials, and optimize industrial heat processes with minimal human oversight. By mid-decade, AI has become so foundational that it powers approximately 25% of all climate equity investment dollars.
The Circular Economy: Reimagining Resource Profitability
The circular economy is no longer a peripheral environmental initiative; in 2025, it is a fundamental business transformation that reshapes global profit pools. By decoupling economic activity from the extraction of virgin materials, companies are building more resilient and profitable organizations.
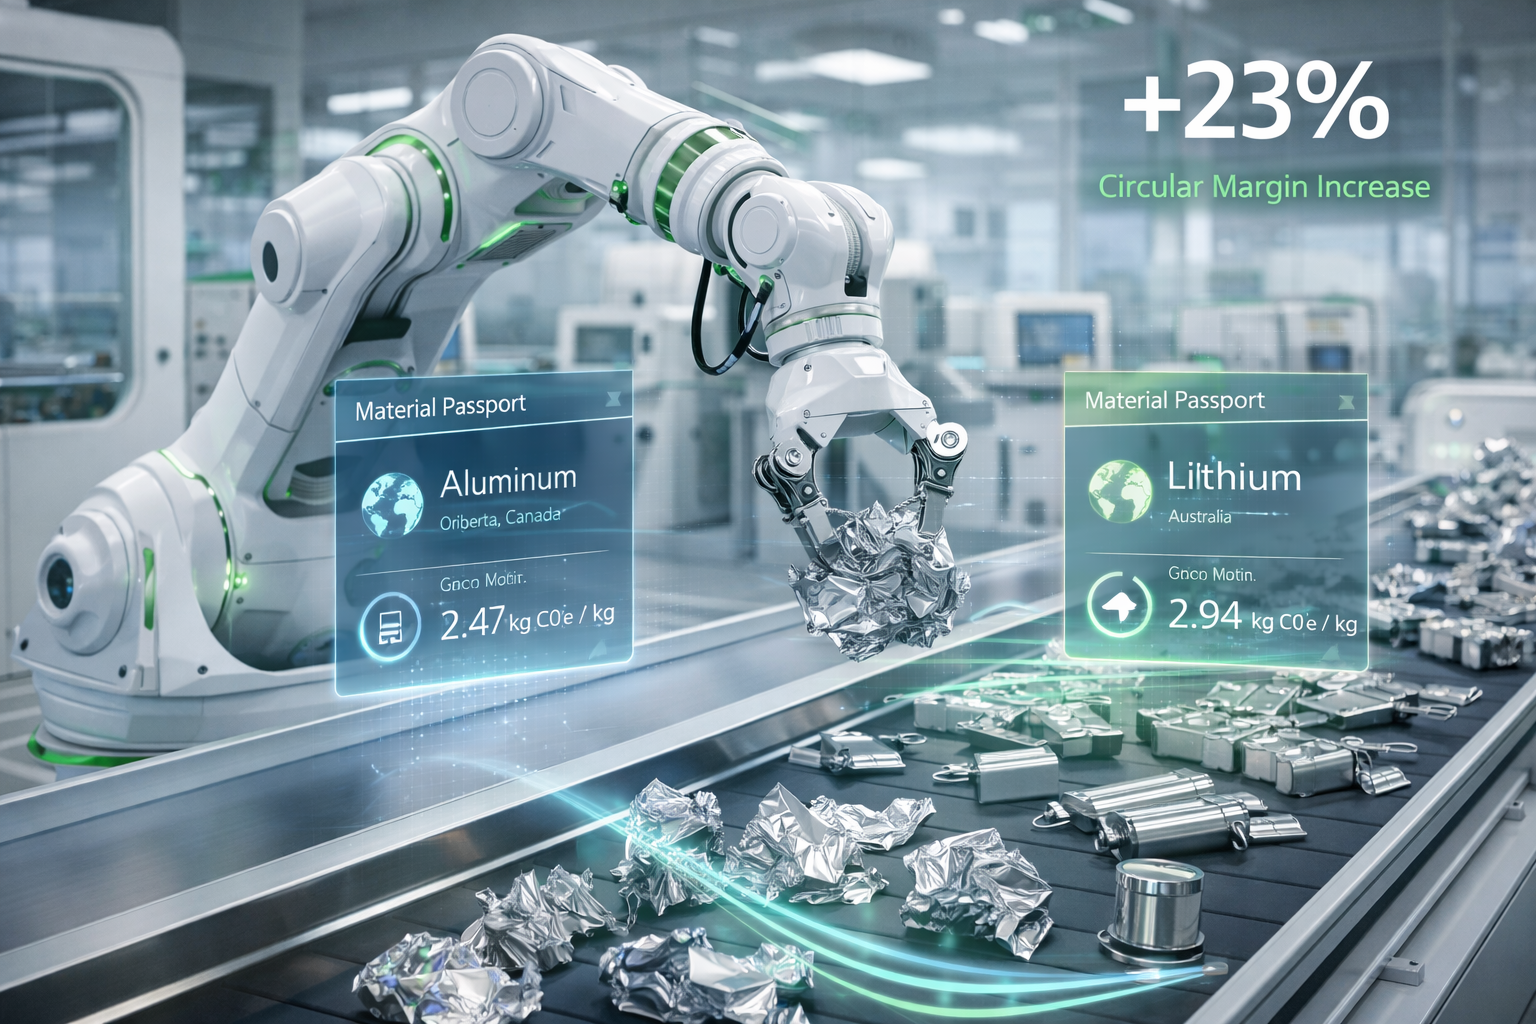
The 23% Margin Increase
Research from 2024-2025 indicates that businesses implementing circular strategies achieve an average profit margin increase of 23% within the first three years. These gains are driven by material cost reductions, new revenue streams from refurbishment, and superior brand valuations.
Value Stream | Mechanism of Benefit | Reported Financial Impact |
Raw Material Savings | Circular procurement vs. virgin buying | 15-35% cost reduction |
Remanufacturing | Extending lifecycle of high-value parts | 40-60% lower cost vs. new |
Product-as-a-Service | Recurring revenue model (PaaS) | 2.4x higher valuation multiples |
Asset Utilization | Resource sharing & urban mining | 67% higher returns on digital circularity |
The "Product-as-a-Service" (PaaS) model is particularly lucrative. Companies like Philips Lighting (lighting-as-a-service) and Hydro (aluminum recycling) retain ownership of the materials while selling the utility. Hydro’s recycled aluminum, produced with only 5% of the energy of primary aluminum, commands premium pricing and is expected to generate up to $750 million in EBITDA by 2030.
Material Passports and Digital Traceability
To make circularity profitable at scale, companies are adopting "Material Passports" and blockchain-based traceability. These digital records achieve 99.7% accuracy in tracking component histories, enabling optimized end-of-life processing that recovers 89% of embedded material value compared to only 43% for non-tracked products. This precision allows manufacturers to forecast costs more effectively and insulate themselves against the supply chain shocks that have plagued the post-pandemic economy.
Policy Realignments: The OBBBA and the Geopolitics of Profit
The legislative landscape for climate tech underwent a major pivot in 2025 with the signing of the One Big Beautiful Bill Act (OBBBA) in the United States. While the 2022 Inflation Reduction Act (IRA) was the largest piece of climate legislation in history, the OBBBA refocused federal support toward industrial-grade decarbonization and "clean firm" energy.
The 45Q and 45X Revisions
The OBBBA significantly modified the incentives for carbon capture and manufacturing. The 45Q tax credit was revised to equalize the credit amount for both permanent storage and utilization—specifically Enhanced Oil Recovery (EOR). The credit is now set at $85/ton for point-source capture and $180/ton for Direct Air Capture (DAC). This shift aims to raise the value of American EOR, which can have a lower carbon content than standard produced barrels, potentially creating a new market for "low-carbon oil".
Conversely, the OBBBA phases out mature wind and solar credits over a two-year period, effectively transferring funds back to the treasury that were previously allocated to energy developers. This repeal forces wind and solar projects to rely more heavily on their underlying economics and the appetite of corporate PPA buyers.
Credit / Provision | IRA Status (2022-2024) | OBBBA Status (2025+) | Impact on Profitability |
45Q (CCS/DAC) | Favored permanent storage | Parity for EOR/Utilization | Boosts oil & gas transition plays |
45X (Manufacturing) | Critical minerals did not sunset | Phase-out begins in 2031 | Discourages new mineral processing |
30D (EV Credits) | Consumer tax credits available | Repealed | Erodes domestic EV demand |
Solar/Wind ITC & PTC | Multi-decade extension | Phased out over 2 years | Rewards mature, low-cost assets |
Trade Wars and Sovereign Infrastructure
The "globalization" of climate tech is increasingly characterized by fragmentation and regional competition. The 2025 market saw the announcement of over 87 new U.S. trade and tariff policies, creating a "black box" of unpredictability for companies with high exposure to international supply chains.
This push for "sovereign infrastructure" has led nations and corporations to double down on localized manufacturing. For instance, Tesla announced in 2025 that it would start manufacturing LFP (lithium iron phosphate) battery cells in the U.S. to comply with domestic content rules. This strategy is not merely about security; it is about reducing exposure to geopolitical risk and capturing the next wave of value creation in the clean energy supply chain.
Adaptation and Resilience: The Next Trillion-Dollar Market
As the physical impacts of climate change accelerate—with $162 billion in economic losses in H1 2025 alone—the market for adaptation and resilience (A&R) has reached an inflection point. Mitigation (emissions reduction) still commands the majority of capital, but A&R is growing faster as investors recognize the urgent need to protect existing assets.
Quantifying the Return on Resilience
McKinsey projects that technologies supporting climate resilience could create a $1 trillion opportunity for private capital by 2030. The focus has moved toward technologies that can be deployed at scale to manage wildfire risk, extreme heat, flooding, and water stress.
A&R Sector | Technology Focus | Commercial Opportunity |
Water Intelligence | Precision ag & desalination | Mitigating $100B+ annual crop loss |
Climate-Risk SaaS | Asset-level risk modeling | Essential for insurance & banking |
Grid Resilience | Microgrids & modular power | Securing critical infrastructure |
Wildfire Tech | AI-driven early detection | Reducing multi-billion dollar payouts |
Investors are increasingly prioritizing startups that offer "A&R-as-a-Service," such as urban cooling or flood management software. In the first three quarters of 2024, 28% of climate tech deals supported A&R startups, a significant increase from previous years. This shift reflects a "flight to quality" where capital flows toward technologies with immediate, real-world applications and measurable risk-mitigation benefits.
The Capital Stack and Exit Dynamics
The maturation of the climate tech market is also visible in how companies exit. In 2025, acquisitions made up 89% of all exits, as large incumbents—including Schneider Electric, Schneider, and even oil and gas majors—picked up smaller players to expand their digital and operational capabilities.
The M&A Buyer's Market
It remains a buyer's market, with 2025 being the second-highest year for exits on record. Strategics are focusing on "bolt-on" acquisitions rather than mega-mergers, seeking targeted add-ons that can be quickly integrated into existing platforms. For example, NextPower led with three solar optimization deals in 2025, while Google acquired Intersect Power for $4.75 billion to secure its own clean energy supply.
The IPO and SPAC Reality
While the SPAC (Special Purpose Acquisition Company) route continued to shrink—falling 22% in 2025 and making up only 4% of exits—the IPO window showed signs of a modest opening. Six climate tech companies went public in 2024, and IPO activity inched up by 17% in 2025. Notably, emerging markets are leading this trend, with India seeing a 20% growth in climate equity raises off the back of multiple public listings.
Operational Excellence as the Ultimate Metric
The central lesson of the 2025 climate tech market is that "making money" requires more than just innovative technology; it requires a superior business model and flawless execution. The transition has evolved from a "technology push" to a "market pull," where customers demand competitive costs and deployment certainty above all else.
The Efficiency Formula for 2026
To achieve high Return on Invested Capital (ROIC), climate tech firms are adopting asset-light strategies that prioritize intellectual property and software-defined systems. The asset-light approach allows for a variable cost structure that protects margins during economic downturns and enables faster scaling by sidestepping the establishment of heavy physical infrastructure.
The ROIC benchmarks for 2025 illustrate the advantage of this approach:
Software-Defined Climate Tech: 20-30% ROIC
Asset-Light Circular Retailers: 15-25% ROIC
Traditional Manufacturing-Heavy Clean Tech: 10-15% ROIC
As the sector moves into 2026, the dominant technologies will be those that can demonstrate "infrastructure-grade reliability". Whether in the form of AI-optimized energy storage, blockchain-enabled circular supply chains, or high-efficiency thin-film solar, the 2025 market has set a clear standard: profitability is the only true measure of sustainability in a performance-driven world.
The maturation phase of climate tech is not a slowdown, but a normalization. Capital is flowing with unprecedented precision toward companies that have proven their commercial viability and climate relevance, ensuring that the energy transition is not just a moral imperative, but the most significant economic opportunity of the century.
Read More -
1. From Idea to MVP: A Step-by-Step Guide for Solo Founder
🔗 https://findnstart.com/blogs/from-idea-to-mvp-a-step-by-step-guide-for-solo-founder
2. How to Validate Your Startup Idea in 48 Hours for $0
🔗 https://findnstart.com/blogs/how-to-validate-your-startup-idea-in-48-hours-for-0
3. Remote vs. Local: Does Your Co-Founder Need to Live in the Same City?
🔗 https://findnstart.com/blogs/remote-vs-local-does-your-co-founder-need-to-live-in-the-same-city
4. The 2026 Startup Landscape: What Has Fundamentally Changed (and Why Founder Skills Matter More Than Ever)
5. The Most In-Demand Skills for Startup Founders in 2026
🔗 https://findnstart.com/blogs/the-most-in-demand-skills-for-startup-founders-in-2026
6. How to Find a Technical Co-Founder (Without a Six-Figure Salary)
🔗 https://findnstart.com/blogs/how-to-find-a-technical-co-founder-without-a-six-figure-salary
7. 5 Red Flags to Look for When Choosing a Startup Partner
🔗 https://findnstart.com/blogs/5-red-flags-to-look-for-when-choosing-a-startup-partner
8. How to Pitch Your Idea to Potential Co-Founders
🔗 https://findnstart.com/blogs/how-to-pitch-your-idea-to-potential-co-founders
9. How to Build a Portfolio that Attracts High-Growth Startup Founders
🔗 https://findnstart.com/blogs/how-to-build-a-portfolio-that-attracts-high-growth-startup-founders
10. Equity vs. Salary: How to Split Ownership with Your First Teammate
🔗 https://findnstart.com/blogs/equity-vs-salary-how-to-split-ownership-with-your-first-teammate
11. Why Joining an Early-Stage Startup is Better Than a Corporate Job
🔗 https://findnstart.com/blogs/why-joining-an-early-stage-startup-is-better-than-a-corporate-job
12. The Future of EdTech: Why Developers and Educators Need to Team Up Now
🔗 https://findnstart.com/blogs/the-future-of-edtech-why-developers-and-educators-need-to-team-up-now
13. The Architecture of Symbiosis: Analytical Perspectives on the Five Habits of Successful Startup Duos
14. Finding a Co-Founder in the AI Space: What Skills Should You Look For?
🔗 https://findnstart.com/blogs/finding-a-co-founder-in-the-ai-space-what-skills-should-you-look-for
15. Overcoming Analysis Paralysis and the Strategic Path to Execution
🔗 https://findnstart.com/blogs/overcoming-analysis-paralysis-and-the-strategic-path-to-execution
16. From College Project to Company: How to Find Your Student Co-Founder
🔗 https://findnstart.com/blogs/from-college-project-to-company-how-to-find-your-student-co-founder
17. How to Start a Startup While Working a Full-Time Job
🔗 https://findnstart.com/blogs/how-to-start-a-startup-while-working-a-full-time-job
18. How to Build a HealthTech Startup Without a Medical Degree
🔗 https://findnstart.com/blogs/how-to-build-a-healthtech-startup-without-a-medical-degree
19. The Solitary Architect: Executive Isolation in Entrepreneurship
20. The 2026 Guide to Launching a SaaS as a Solo Developer
21. What Sustainable Growth Actually Looks Like
🔗 https://findnstart.com/blogs/what-sustainable-growth-actually-looks-like
22. The Early Warning Signs Your Startup Is in Trouble
🔗 https://findnstart.com/blogs/the-early-warning-signs-your-startup-is-in-trouble
23. How to Grow Without Burning Out
🔗 https://findnstart.com/blogs/how-to-grow-without-burning-out
24. The Truth About “Runway” Most Founders Ignore
🔗 https://findnstart.com/blogs/the-truth-about-runway-most-founders-ignore
25. Revenue Solves More Problems Than Funding
🔗 https://findnstart.com/blogs/revenue-solves-more-problems-than-funding
26. What No One Tells You About Being a Solo Founder
🔗 https://findnstart.com/blogs/what-no-one-tells-you-about-being-a-solo-founder
27. Why Smart People Quit High-Paying Jobs to Build Startups (And Why Most Regret It)
28. Why Most Startup Advice on Twitter Is Dangerous
🔗 https://findnstart.com/blogs/why-most-startup-advice-on-twitter-is-dangerous
29. Decision Fatigue: The Silent Startup Killer
🔗 https://findnstart.com/blogs/decision-fatigue-the-silent-startup-killer
30. Fear vs Logic: How Founders Actually Make Decisions
🔗 https://findnstart.com/blogs/fear-vs-logic-how-founders-actually-make-decisions
31. How Overthinking Destroys Early Momentum
🔗 https://findnstart.com/blogs/how-overthinking-destroys-early-momentum
32. Ideas Don’t Scale. Systems Do.
🔗 https://findnstart.com/blogs/ideas-dont-scale-systems-do
33. The First Hire That Actually Matters
🔗 https://findnstart.com/blogs/the-first-hire-that-actually-matters
34. How the First 100 Users Decide Your Startup’s Fate
🔗 https://findnstart.com/blogs/how-the-first-100-users-decide-your-startups-fate
35. Why Your Startup Doesn’t Need Growth — It Needs Focus
🔗 https://findnstart.com/blogs/why-your-startup-doesnt-need-growthit-needs-focus
36. Why Most Startups Die Quietly
🔗 https://findnstart.com/blogs/why-most-startups-die-quietly
37. Lessons Learned Too Late by First-Time Founders
🔗 https://findnstart.com/blogs/lessons-learned-too-late-by-first-time-founders
38. The Myth of the “Overnight Success” Startup
🔗 https://findnstart.com/blogs/the-myth-of-the-overnight-success-startup
Want to calculate the equity for your cofounder?
Nail your cap table before you sign. Whether you're splitting equity with a co-founder or planning your next funding round, our Equity Calculator gives you precision in seconds
Equity calculator →